International And U.S. Markets See 50-75% Drop In New Listing Volumes
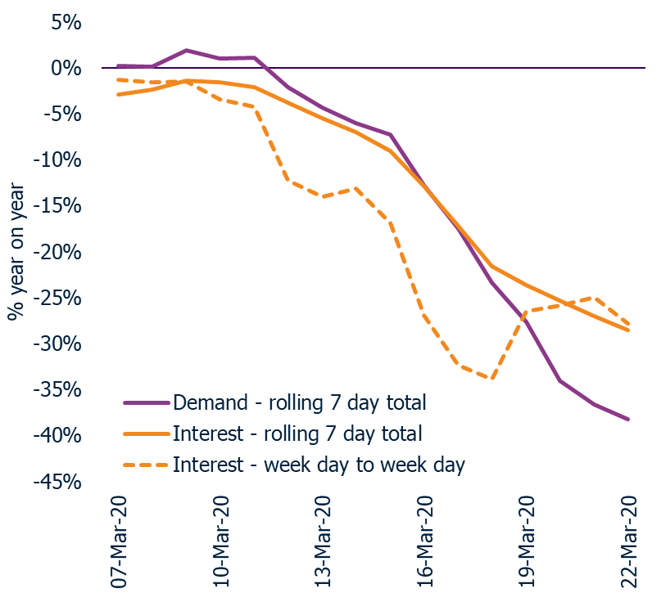
As the pandemic and associated effect on the real estate market spreads, one of the best leading indicators of a decline in transaction volumes -- new listings -- has dropped an average of 63 percent in the earliest hit markets. Seattle, the Bay Area, and New York City -- along with Italy and the U.K. -- were among the first markets hit, and are the best examples of what comes with strict lockdowns.

Declining Market Activity

In Seattle (King County), the number of new listings is down 54 percent on a weekly basis, and continues to trend lower.

 
Screen Shot 2020-04-05 at 9.59.19 AM.png
 

On a weekly basis, new listings in the East Bay market of California are down 70 percent since the start of shelter in place orders. Listings typically increase at this time of year.

 
Screen Shot 2020-03-30 at 2.01.21 PM.png
 

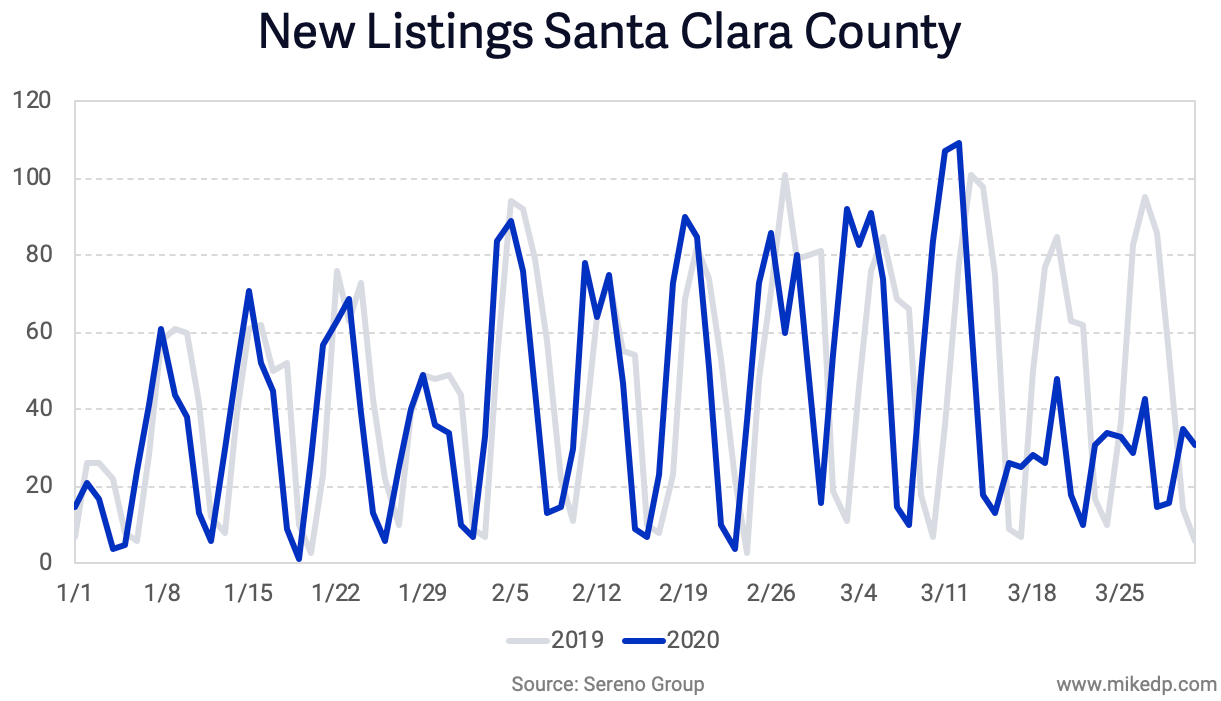
In Santa Clara county, which went on lockdown March 16th, new listings are down 48 percent on a weekly basis.

 
Screen Shot 2020-04-05 at 9.48.47 AM.png
 

In New York City, new listings are down a whopping 78 percent across Manhattan, Brooklyn, and Queens, and continue to trend lower.

 
Screen Shot 2020-04-05 at 9.48.42 AM.png
 

Many shelter in place orders took effect in mid-March, so we’re just starting to see the effect on the housing market.

International Peers

The trend is similar in a number of international markets. According to Zoopla, the #2 portal in the U.K. (which exclusively shared the following information with me), new listing volumes are down 70+ percent across the country. It’s a shocking decline that will have ramifications across the industry for the rest of the year.

 
MDP03042020.png
 

In Italy, a top portal shared with me that new listings were down 60 percent from normal volumes during the third and fourth week of lockdown.

 
Screen Shot 2020-04-06 at 7.44.15 AM.png
 

It's important to note that this appears to be the bottom; after 2-3 weeks of lockdown, new listings were down 60 percent and have not dropped any lower.

A drop in new listings directly correlates to the severity of lockdown. Some international markets, like Germany, the Netherlands, and Sweden -- with less stringent lockdowns -- have not seen a dramatic drop in new listing activity.

The Ability vs. The Will To Buy A Home

When evaluating the pandemic’s effect on the market, it’s tempting to focus on the legal, logistical, and practical aspects of transacting real estate: is it an “essential” business, can open homes take place safely, and can closings occur online?

But that analysis misses an important psychological piece: Will consumers buy homes? Given the incredible market uncertainty, job uncertainty, and health and safety considerations, will consumers choose right now as the ideal time to buy or sell a home, or will they wait? Just because they can, doesn’t mean they will.

A Mild Case of Confirmation Bias

Many markets have yet to experience the full effect of the pandemic and lockdowns on home sales. Assuming it takes 90 days to sell a home, from listing to close, it will take several months to see the effects of a drop in new listings.

Given that inherent delay, there’s plenty of data available -- especially in markets that have yet to be hit -- that everything is fine. Homes are selling, listings are coming to market, and buyer demand remains strong. 

Confirmation bias is the tendency to search for, interpret, and favor information in a way that confirms one's prior beliefs or hypotheses. It’s quite easy for a real estate professional, who believes their market won’t be affected like the others, to find evidence to support that belief.

Evidence from international markets such as China, Italy, and South Korea, plus leading indicators from the first markets to be hit in the U.S., clearly shows the effects of strict lockdowns. The key criteria as the pandemic and lockdowns spread is timing; just because the tidal wave hasn’t hit yet doesn’t mean it won’t arrive.

Real Estate Portals See Up to 40% Drop in Traffic, Leads

The spread of the coronavirus -- and associated lockdowns, quarantines, and travel restrictions -- have caused a dramatic drop in traffic and leads at the world’s top real estate portals. These metrics are critical indicators of a top of the funnel slowdown in the real estate market.

A Global Overview

The data below is from a handful of leading real estate portals around the world: SeLoger in France, Zoopla in the U.K., Funda in The Netherlands, Zillow in the U.S., and a European portal and a U.S. portal that wish to remain anonymous. The evidence is clear: on average, portals are seeing around a 30 percent drop in traffic (as a weekly moving average) as a result of the pandemic.

 
Screen Shot 2020-03-26 at 10.32.29 AM.png
 

The data shows a similar, although slightly higher, decline in the number of leads being generated by the portals -- ranging from 28 to 50 percent, with an average of 33 percent.

 
Screen Shot 2020-03-26 at 10.24.48 AM.png
 

The spreading pandemic is clearly affecting the world’s top portals. They are generating less traffic and considerably less leads, which is a reflection of a slowing property market. 

U.K. Snapshot: Zoopla

Zoopla is the U.K.’s second-largest portal by traffic, and is on the front lines of up-to-date data analysis. Over the course of March, it has seen a 30 percent drop in traffic (interest) and a 40 percent drop in demand (leads generated through the system).

 
Report fig 3.png
 

Interestingly, Zoopla is seeing a slight rebound in traffic over the past few days -- likely as consumers adapt to their new reality, shut themselves indoors, and turn to the portal as a form of browsing entertainment. The trend is similar in The Netherlands, where leading portal Funda reports that traffic is slowly growing back to normal levels.

U.S. Snapshot: Zillow

During an earlier conference call, Zillow stated its traffic was down 20 percent from last year. Considering its traffic was up 10 percent annually in the previous quarter, the weekly decline is closer to 30 percent -- which matches the stated decline in connection requests, or leads, through the system.

Another large U.S. real estate portal (not a publicly traded company) was willing to anonymously share its traffic and lead statistics. The 30 percent traffic drop in March is clear (and most likely reflective of the other U.S. portals).


This same portal reports a corresponding drop in leads of 28 percent, closely matching the drop in traffic, and nearly identical to category leader Zillow.

True Discounts

Earlier this week I conducted an analysis of how the top real estate portals around the world were reacting to Covid-19, primarily by offering customer discounts. For agent and broker customers of these portals, it’s worth understanding that a reduction in fees comes along with a reduction in leads.

For example, Zillow is offering its premier agent customers a 50 percent discount, but for 30 percent fewer leads. 

 
Screen Shot 2020-03-26 at 10.46.11 AM.png
 

Assuming a hypothetical situation where a customer was spending $10,000 for 100 leads, that customer is now spending $5,000 for 70 leads -- the true discount is closer to 29 percent.

Top of the Funnel

A drop in portal traffic -- and the associated leads generated through the system -- is the ultimate, top of the funnel measure of a slowdown in real estate transactions. Consumers are reducing their visits to real estate portals, which is a more passive interaction with the market, and significantly reducing the number of lead forms filled out to inquire about a property, which is a more active measure of intent.

A drop in leads will ripple through the entire real estate ecosystem. Less leads for agents means less business, and less business means less transactions. The key questions to watch in the coming weeks (and months) are: Does the drop in leads go any lower, how long does the decline last, and how long will the recovery be before we’re back to normal levels?

Further Reading and Thanks

I've published several analyses of the massive changes occurring in the real estate industry since the COVID-19 pandemic:

I have deep gratitude for the portals that shared their data for this analysis -- either publicly or directly with me. Making this information available helps us replace uncertainty and fear with a growing certainty and resiliency. Thank you!

How Real Estate Portals Are Reacting to COVID-19

As the coronavirus pandemic and the associated impact upon global economies spreads, the world’s leading real estate portals are all making big moves in response. Significant discounts are being rolled out for customers, new products are being launched, and sobering revenue projections are being shared.

The Leading Portals React

Strict quarantines, market uncertainty, and travel restrictions are causing plummeting real estate transaction volumes in many markets. Portals are facing -- and will face in the coming weeks -- a significant drop in traffic and leads. In France, top portal SeLoger noted a 40 percent drop in traffic, while in The Netherlands, leading portal funda noted a 35 percent drop in leads (more on this in a future analysis).

The drop in traffic and leads, in a market where transaction volumes are dropping by up to 80 percent, is causing portals to roll out significant discounts for their agent customers. 

 
Screen Shot 2020-03-27 at 7.28.23 AM.png
 

In the U.S., leading portals Zillow and realtor.com announced deep discounts on agents’ next monthly bills, with Zillow cutting 50 percent and realtor.com 60 percent. While a welcome savings to an agent’s bottom line, it comes at significant cost, with Zillow estimating a $40–$50 million hit to revenue. It’s unlikely the crisis will be over in a month, so there’s a good chance the discount may be extended beyond April.

The leading portals in the U.K. are following a similar approach, but with deeper and longer-lasting discounts. Rightmove is slashing 75 percent off agent bills for four months -- at a cost of £65–£75 million. For a business that booked £289 million in revenue during 2019, that’s a material hit.

The #2 portal, Zoopla, is being even more aggressive with its discounts. Agents can get 3–5 months completely free, or nine months free if the customer leaves Rightmove and commits to an 18 month contract.

In Australia, leading portal REA Group is postponing its July price rise (8 percent), and offering free re-listings of premium depth products. 

Germany’s Scout24 is offering to defer one month’s payment for up to nine months, and is offering free private listings for consumers. And in France, SeLoger is deferring March fees and making April fees free. Both Scout24 and SeLoger are also offering free premium products to agents at the end of the crisis.

Product Improvements

In addition to discounts, some fast-moving real estate portals are making product improvements in response to the dynamic situation. Sweden’s Hemnet rolled out live streamed open house viewings for its agents last weekend, and is working on further product improvements to streamline transactions with limited direct human interaction.


In The Netherlands, funda kicked off a week-long hackathon to respond to changing customer needs. The focus is on providing fresh data and insights for customers, and enhanced support for remote viewings.

Observations and Strategic Implications

I note a few key takeaways from the evidence above:

  • The discounts will cause a huge impact on revenue. Rightmove is projected to take a £70 million revenue hit -- or 27 percent of total revenue in 2019. Zillow’s revenue hit could approach 10 percent (of premier agent revenues) or more. These revenue hits don’t include customers that cancel their subscriptions or simply go out of business during the year.

  • There is a significant spread of discounts being offered, from simple deferments to multiple months completely free. The more competitive the market, the more competitive the offers are in order to retain or attract customers. The discounts are deepest in the U.K.

  • Certain markets, including Australia, Sweden, and New Zealand are vendor-funded, meaning the homeowner pays the portal listing fee, not the agent. The portals in these markets have not yet offered discounts, but will still feel a revenue hit when new listings drop.

It’s a fast-moving, dynamic time in the portal industry. The major players are all making significant moves to retain their agent customers and ease their upcoming financial burden.

Survival of the Fittest: The Real Estate Pandemic Survival Guide

My recent presentations usually start with this message: The industry is moving slowly, but it’s never moved this fast. That has never been more true than today.

International and historical data shows that as the pandemic spreads and more stringent lockdown measures are put in place, the volume of real estate transactions will drop significantly -- up to 90 percent. While the drop is temporary, only the most agile and resilient businesses will survive.

Transaction Volumes Will Drop

The available data from China, South Korea, and Italy shows that the current pandemic will likely cause a temporary, but dramatic, drop in overall real estate transactions.

The following chart shows property transactions in China during the early stages of the outbreak. Transactions dropped significantly -- nearly 100 percent -- during a number of weeks during the crisis, and are now growing again (but still down over 50 percent from last year).

 
Slide8-60-1024x583.png
 

There are similar results in Italy, with a top portal telling me that they expect transaction volumes to be down 20–40 percent in February and 70–90 percent in March. Another source cites that visits to apartments for sale in early March were down more than 50 percent compared to a year ago.

 
Screen Shot 2020-03-21 at 10.27.45 AM.png
 

In South Korea, national deal volume was down 80 percent in the first nine days of March, and down 90 percent in the nation’s capital of Seoul.

Zillow’s recent research on pandemics shows a similar trend from Hong Kong during the SARS outbreak in 2003: Transaction volumes fell by 33-72% as customers avoided human contact (“avoidance behavior” like avoiding travel, restaurants, and public gatherings). After the epidemic was over, transactions snapped back to normal.

 
TransactionsRealEstatePrices-ea551e.png
 

The drop in transactions is immediate and severe, but appears to be temporary. The data suggests that it may take up to six months (or more) for transaction volumes to return to normal levels.

Virtual Tours Won’t Save Your Business

It’s likely that we’ll see plummeting transaction volumes in other international markets as the pandemic spreads. There will be more than a predisposition for social distancing; it will be a temporary halt to a large portion of the real estate market (as evidenced by the data above).

Virtual tours won’t stop the decline; they are no replacement for an actual in-home visit. If transaction volumes drop by 80 percent or more -- driven by market uncertainty, quarantines, travel restrictions, and shelter in place orders -- no amount of virtual tours or clever online outreach will make up for that decline.

Long Term Consumer Behavior Changes

The pandemic may very well leave behind a number of long-lasting changes that impact the world of real estate in its recovery.

Social distancing may lead to the accelerated adoption of services that facilitate streamlined real estate transactions. Once more consumers experience the benefits of selling a home without dozens of open home visitors, iBuyers may see increased adoption. Once home buyers experience a closing with an online notary, more will expect it next time.

New products and services, including iBuying, online notaries, and virtual tours may become a new customer requirement in a world of increased social distancing. It’s an evolution of consumer needs, not a solution to a pandemic. And those individuals and firms that best meet changing consumer needs generally win.

Survival of the Fittest

Using the data above as a reference, it appears likely that the current pandemic will cause a significant drop in transaction volumes for a period of time, after which activity will resume and approach normal -- but only after many months.

The most important strategy for businesses and agents alike becomes quite simple: make sure you’re around for the rebound.

It’s nearly impossible to pivot to a new businesses model during an economy-shuttering pandemic. Virtual tours won’t save your business when transaction volumes drop 80 percent. The alternative strategy is to weather the storm -- cryogenically freeze yourself -- ready to emerge when the recovery begins.

All real estate businesses will be moving quickly to adapt to the changing environment. It’s those that are able to move the fastest, adapt gracefully, and have the strongest foundation and balance sheet (survival of the richest) that will survive and thrive in the recovery.

The Real Estate Pandemic Survival Guide

With the evidence and hypothesis outlined above, I conclude with the following Real Estate Pandemic Survival Guide.

Step 1: Be Around for the Recovery. There is a temporary period of pain to get through. You must survive. Lower your expenses and conserve cash to give yourself the longest runway possible. Virtual tours won’t save your business.

Step 2: There is No Step 2. Survival is everything.


The industry -- and the world -- is moving incredibly fast, and I find it difficult to keep up with all of the changes.

Like many of you, I'm working outside of my comfort zone (and in my house surrounded by my family). I have less time to collect data, analyze evidence, and present thoughtful insights -- and I'm doing my best.

I am prioritizing releasing new data and insights as quickly as possible, to help guide us all through these uncertain times. Expect more in the weeks and months ahead.

iBuyers Pause Purchases During Pandemic

The world moves fast. In the past 24 hours, both Opendoor and Redfin announced a temporary halt to their home buying operations.

Pausing Home Purchases

The current pandemic is truly a Black Swan event, and more significant and complex than a housing market correction. The iBuyer model was designed with counter-measures to counteract a correction, including raising fees, slowing purchases, and anticipating a slowdown before it hit.

The current situation is more extreme and uncertain. There are extensive public health considerations at play and varying degrees of lockdown and shelter in place orders, which may make all real estate transactions untenable for a period of time.

Redfin pausing its home buying activity is notable, but not nearly as big of a deal as Opendoor’s announcement. Redfin has many other sources of revenue; Opendoor does not. Opendoor was purchasing about 40 times the number of homes as Redfin.

 
Screen Shot 2020-03-19 at 9.33.11 AM.png
 

While iBuying has certain advantages in a world of social distancing, those advantages don’t carry over to a pandemic or mass quarantine.

A Temporary Drop in Transactions

The data available shows that the current pandemic will likely cause a temporary, but dramatic, drop in overall real estate transactions.

The following two charts show property transactions in China during the early stages of the pandemic. Transactions dropped significantly -- 80 to 90 percent -- during a number of weeks during the crisis, but are now growing again.

W200309_REEVES_IMPACTOF.png
Screen Shot 2020-03-19 at 10.05.24 AM.png

Zillow’s recent research on pandemics shows a similar trend from Hong Kong during the SARS outbreak in 2003: Transaction volumes fell by 33-72% as customers avoided human contact (“avoidance behavior” like avoiding travel, restaurants, and public gatherings). After the epidemic was over, transactions snapped back to normal. 


The drop in transactions is immediate and severe, but appears to be temporary.

Opendoor's Glide Slope

By temporarily pausing the purchase of homes, Opendoor has shut off its only source of revenue; there’s no iBuying without buying. The effect is akin to an airliner losing both engines while in flight.

With no revenue -- Opendoor’s engines -- the company will glide until it either manages to once again generate revenue, or it runs out of money. Opendoor is not alone in this predicament; many businesses across a number of industries face the same challenge.

 
screen-shot-2016-09-09-at-10-18-22-am-e1473430782777.png
 

Opendoor won’t sit still. There are many smart people at the organization that are likely working around the clock to pivot, adjust, and invent new ways of doing business in this rapidly changing environment. When you have a business with over 1,000 employees on the payroll, waiting and hoping isn’t an option.

Unintended Advantages: iBuying in a World of Social Distancing

It’s unlikely a global pandemic is what Opendoor and Zillow had in mind when they launched iBuyer businesses. The core benefits of the model -- speed and certainty -- were meant to improve upon a notoriously long and sometimes painful process. But the iBuyer business model is uniquely positioned to thrive in a world of social distancing, where people are putting a premium on the ability to conduct business while limiting direct human contact.

Unintended Advantages

While iBuying launched with specific consumer benefits in mind, it’s becoming evident that the model has several unintended advantages in a world of social distancing. At its core, the model allows consumers to sell and buy homes with limited human interaction -- a fact that had niche appeal in a normal market, but may become more popular in today’s uncertain market.

Today, those advantages include:

  • No Open Homes: Homeowners have the advantage of selling their homes directly to an iBuyer, without needing to hold open homes with dozens of people walking through their house.

  • Self-Guided Home Tours: Prospective home buyers can tour homes owned by iBuyers on their own, without an agent present, and outside of a crowded open home.

  • No In-House Repairs: Selling to an iBuyer removes the necessity of homeowners having external contractors in a house to conduct pre-sale repairs.

Most importantly, selling a home to an iBuyer provides certainty in a time of uncertainty -- and we are definitely in a time of uncertainty. The advantage of selling a home instantly has never been demonstrated in a more dramatic fashion.

Tracking Fee Changes

Since the day Opendoor launched in 2014, people have wondered how the model fares in a down market. One argument in favor of the iBuying model is that in times of uncertainty, consumers would be willing to pay a higher fee for the certainty that an iBuyer provides.

The data is still coming in, but a quick sample of several dozen iBuyer offers from last week (March 9–13) across 14 markets shows no change in the average fee charged to consumers.

 
a70e68f8-9353-4f06-badd-cb6dfb6bacf7.png
 

It is likely a fee increase will come, to account for the higher risk and uncertainty in the market (iBuyers generally charge a higher fee when there is more market risk). But for the moment, fees remain low, likely in an effort to keep up purchase volumes so as not to exhaust inventory.

Declining Purchase Activity

In the weeks ahead it will be worth paying attention to overall iBuyer volumes.

There are already early signs of a slowdown in the Phoenix market, the birthplace and epicenter of iBuying. Whether driven by inventory shortages, global market uncertainty, or iBuyers mitigating their risk, significantly less homes are being bought each month in Phoenix.

 
4a248f72-244d-4fd6-83fb-1bbf580183a1.png
 

Total iBuyer purchases in Phoenix for February are down 30 percent year-on-year; Zillow in particular is down 63 percent from the same time last year.


Compared to the previous month, January, purchase volumes are down from 368 to 315, or 14 percent. At the same time, iBuyer home inventories are at an all-time low: at current monthly sales rates, Opendoor has two months of inventory and Zillow just one month. The iBuyers are clearing their inventory quickly by selling almost two homes for each home they purchase.

Implications for iBuyers and the Industry

In the months ahead, I would expect iBuyers to react appropriately to a slowing and uncertain market:

  • Raise fees to account for increased market risk and houses potentially taking longer to sell, driven by less overall consumer demand.

  • Reduce inventory, by purchasing less homes each month (Phoenix as an example) and continuing to clear existing inventory with appropriate price reductions.

The current state of the market will finally shine a light on how the iBuyer business model reacts to slowing consumer demand. On the one hand, the iBuyer proposition becomes stronger for consumers looking for certainty and to limit direct human interaction. But on the other hand, iBuyers are at-risk in a market slowdown by holding hundreds or thousands of unoccupied homes on their balance sheets.

What to Expect When You’re Expecting Revenue Growth: Rightmove’s Strategy

Rightmove’s annual financial results were released on February 28th, revealing a business whose revenue growth has dropped to an all-time low. This analysis focuses on several key charts -- all about growth -- that are absent from Rightmove’s annual report, but are critical to understanding its strategy.

Declining Revenue Growth

Rightmove’s revenue growth in 2019 was the smallest it's ever been -- 8 percent -- the low point in a multi-year decline.

 
20f07e1f-8e9b-4e94-ab3f-7af42632e58b.png
 

The primary driver of Rightmove’s revenue, representing 72 percent of total, is the core agency listing business. This consists of fees that estate agents pay to list properties for sale on Rightmove. The growth rate of this business has dipped to 4 percent, less than half of last year, and the lowest rate in years.

 
b90192ac-b934-4c69-b8a9-5bff0dd4fa61.png
 

Rightmove has saturated the U.K. market. Every estate agent that could possibly be a customer generally is. Therefore, the only way to increase revenues in the agency listing business is by raising prices, evidenced by the following chart from Rightmove’s annual report.

 
b90192ac-b934-4c69-b8a9-5bff0dd4fa61.png
 

The vast majority of Rightmove’s revenue growth -- 84 percent -- came from raising fees. However, Rightmove’s ability to raise prices -- or, as I like to say, to charge customers more money for the same service -- is diminishing. Average revenue per advertiser growth, or ARPA, continues to decline year after year. 

 
7a09b819-ab95-4618-91df-d10ccc939e83.png
 

Responding to Slowing Growth

Rightmove’s revenue growth is slowing, and investors may have a growing curiosity about the source of future growth.

In the U.S., Zillow underwent a similar slowdown in its core lead generation business, the flagship Premier Agent program. During the second half of 2018 and 2019, revenue growth in the business significantly slowed and nearly stopped, illustrated in a chart not too dissimilar from those above.

 
75069962-6b5a-49b3-8293-88ed21ced86e.png
 

What does a business do when growth in its primary revenue stream slows? Launch new revenue streams, of course.

In the midst of Zillow’s growth slowdown, it launched several new initiatives: Zillow Offers, its iBuyer business, in mid-2018, a new pricing model, Flex Pricing, in October 2018, and in November 2018 it acquired a mortgage company.

Zillow Offers and Zillow Home Loans offered completely new revenue streams for the business to grow, and Flex Pricing offered its customers a new way to utilize its core service with a different pricing model, and not just higher prices. In the face of growth headwinds, Zillow acted decisively to diversify its business model.

Rightmove's Strategy

Measured by traditional financial metrics, Rightmove is a fantastic business. It is a category leader in the U.K., with an enviable profit margin of 74 percent on revenues of £289 million. But as a public company, it naturally faces pressure to grow -- and that growth has steadily slowed over a number of years.

But even with slowing growth, Rightmove has maintained its commanding traffic lead over rivals (as illustrated in my strategic analysis of real estate portal leadership). Rightmove does not appear to be at risk of losing its market dominance.

 
4bcc2b05-99bf-4655-a731-22f49107ee5e.png
 

What Rightmove is demonstrating -- consistently, year after year -- is a unique strategy in the world of real estate portals. While other portals are vertically integrating, diversifying their services, or getting closer to the real estate transaction, Rightmove maintains a conservative and focused approach.

Time will tell if this approach is sufficient, or if Rightmove will also need to act decisively to diversify its model to satisfy shareholder demands to grow.

Millions More Buyers: A Real Estate Portal’s Competitive Advantage 

REA Group, Australia’s leading and the world’s most profitable real estate portal, recently unveiled a new advertising campaign theme that succinctly sums up a portal’s competitive advantage: Millions More Buyers.

Real estate portals benefit tremendously from network effects, which is the key factor that gives them unprecedented market power and an impregnable moat to repel competition. This analysis looks at international portal leadership across three markets, and explores the challenges of competing with a leading portal.

The Power of Network Effects

Network effects is the phenomenon whereby a service becomes more valuable when more people use it. Online marketplaces and social networks such as Facebook, eBay, and Craigslist are classic examples of businesses with network effects.

Businesses that have the benefit of network effects are incredibly difficult to displace. Even if a new entrant’s product is objectively better, a smaller audience of potential buyers and sellers means an inferior consumer proposition. Sellers want to advertise to the biggest audience possible, and buyers want the largest selection possible.

Real estate portals like REA Group in Australia and Zillow in the U.S. have a strong competitive position because they have Millions More Buyers than any other platform. This key attribute, enabled by network effects, results in leading portals easily maintaining their leadership position against well-funded competition.

Rightmove vs. Zoopla vs. OnTheMarket in the U.K.

In the U.K., Rightmove is the long-standing dominant real estate portal, Zoopla number two, and OnTheMarket the industry-backed upstart.

For all the cyclical uproar aimed at Rightmove over its ever-increasing fees, its traffic dominance shows no signs of waning. It remains the undisputed best place to advertise properties for sale, with Millions More Buyers than its closest competition.

 
Screen Shot 2020-02-29 at 6.58.41 PM.png
 

All three portals reported higher January traffic than the two previous years. And while the percentage gains sound impressive for the smaller portals, it’s from a smaller base.

 
Screen Shot 2020-02-28 at 4.42.34 PM.png
 

Of more interest is the net gain of new visits: 9 million for Rightmove, 8.3 million for Zoopla, and 6.5 million for OnTheMarket. Rightmove captured the most new visitors, with Zoopla close behind, while OnTheMarket captured 28 percent less new visitors. Rightmove’s lead in absolute visits to its web site is growing.

Rightmove’s traffic lead over its next closest rival remains strong and fundamentally unchanged over a number of years, despite several companies attempting to challenge its dominance.

 
Screen Shot 2020-02-26 at 10.54.14 AM.png
 

Even after Zoopla’s $3 billion acquisition by private equity firm Silver Lake in 2018, and OnTheMarket raising and spending tens-of-millions of pounds to compete with the leading portals, Rightmove’s traffic dominance remains intact.

Zillow vs. realtor.com in the U.S.

Zillow’s arch-competitor in the U.S. market is realtor.com, owned by News Corp. Zillow’s reach is massive: In Q4 of 2019, Zillow’s average monthly unique visitors clocked in at 173 million compared to realtor.com’s 59 million. That lead has remained consistent over a number of years.

 
Screen Shot 2020-02-26 at 10.53.59 AM.png
 

A more granular examination of traffic between the two portals shows the seasonal nature of visits throughout the year, with Zillow maintaining its lead.

 
Screen Shot 2020-02-26 at 10.53.56 AM.png
 

Like its international peers, Zillow’s traffic lead has remained consistent over the past several years. Even after realtor.com’s $950 million acquisition by News Corp in 2014, when the case could be made for further resources being invested into the business, Zillow’s traffic lead has remained steady: Zillow has Millions More Buyers.

REA Group vs. Domain Group in Australia

Australia’s REA Group, which is also majority owned by News Corp, is the world’s most profitable real estate portal. Its lead over rival Domain Group has remained consistently strong over the past several years, and appears to be increasing.

 
Screen Shot 2020-02-26 at 10.54.06 AM.png
 

Domain Group threw off the shackles of a more traditional and risk-averse owner, Fairfax Media, when it was spun out and went public in November 2017. Part of the rationale was to deepen the investment in the business to fully capitalize on the opportunity in front of it. But that deeper investment hasn’t made a dent in REA Group’s traffic lead.

Furthermore, REA Group has consistently turned its traffic lead into a revenue-generating lead as well. Not only are its revenues exponentially higher than Domain Group, but it is growing them faster than the runner-up portal. 

 
Screen Shot 2020-02-26 at 10.53.37 AM.png
 

REA Group’s Millions More Buyers turns out to be more than a slogan; it’s also a valuable service that advertisers are willing to pay a premium for -- significantly more than other advertising channels. There is a premium for advertising a property for sale on the country’s most popular platform.

Happy in Second Place

In 2018, News Corp CEO Robert Thomson, referring to realtor.com, said, "Obviously we’re in a competition, long term, to be number one..."

News Corp has been a major investor in Australia’s REA Group for two decades. More than most, it understands the power of network effects and how expensive and futile it can be to unseat a market-leading portal.

It’s unlikely that News Corp realistically expects to overtake Zillow in the U.S. Attempting to overtake Zillow would be incredibly expensive with an uncertain outcome, and the resulting marketing war would drain huge amounts of cash from both companies.

It’s a similar story in the U.K, with runner-up portal Zoopla’s CEO saying, “We want to be the portal of choice for agents and consumers.” It’s clearly an aspirational goal, but being the portal of choice is difficult when your competition has Millions More Buyers. And so far, over the past three years, Rightmove’s traffic dominance has remained intact.

Being the underdog and striving to overtake the market leader is a great story and good for morale, but it’s an unlikely business strategy.

Misplaced Motivation

Attempting to compete directly with a leading portal is at best expensive, and at worst futile.

The evidence suggests that it is nearly impossible for a runner-up portal to overtake the leader. In fact, there is no evidence that the all-important traffic leadership metric between the top two portals can be budged even a small amount.

Which begs the question: Why are upstart portals attempting to displace leading portals? OnTheMarket launched in 2015 to challenge the duopoly of Rightmove and Zoopla in the U.K. It was founded by a broad consortium of traditional real estate agencies who didn’t appreciate the market and pricing power enjoyed by the existing portals. According to its CEO, it was founded to provide an “alternative search platform” for consumers.

When brokers banded together in the Hamptons to launch a portal to compete with Zillow, the rationale was to “create something that’s owned by the brokers." These organizations, with Millions Less Buyers, are launching portals that are good for themselves, not consumers.

Traffic Growth vs. Revenue Growth

Traffic leadership does not equate to revenue growth. Just because a top portal has a dominant traffic lead over its competition does not necessarily mean that portal can continue to grow its revenues.

Leaders like Zillow and Rightmove have experienced this firsthand. Although both portals retain strong traffic leadership positions, both are experiencing or have experienced a slowdown in residential advertising revenue growth.

 
75069962-6b5a-49b3-8293-88ed21ced86e.png
 

Growth in Zillow’s Premier Agent business slowed significantly in late 2018 and 2019, while Rightmove is experiencing a continued slowdown in its Agency listing business.

 
Screen Shot 2020-02-28 at 10.25.19 AM.png
 

Network effects lead to insurmountable traffic leads for the top real estate portals, but don’t guarantee unchecked revenue growth. To grow, portals still need to provide new, value-added services to customers, and not simply raise prices.

Millions More Buyers

Late in 2019 I sold my house in New Zealand and experienced firsthand the value of Millions More Buyers. The country’s leading property portal, Trade Me, delivered over 10 times the clicks to my property listing than the runner-up portal — 3,100 vs. 300 (read my full analysis).

Attempts to compete directly with the leading portals — from both upstarts and financially strong runner-up portals — have met with limited success. Having deep pockets and a better or differentiated product makes little difference. The ultimate competitive advantage — powered by network effects — is Millions More Buyers. And it turns out that’s what consumers care about most.


Download this strategic analysis as a lovely, nine-page PDF.


The Three Eras of Compass

Compass is a disruptive force in real estate. I believe it to be the world’s most well-funded brokerage, with over $1.5 billion raised, and as a result, the world’s fastest growing brokerage with annual growth rates of 150 percent.

As the company navigates a large, complex industry, and attempts to find its own place in the world, its growth strategy has evolved. Looking back several years, the company has clearly gone through three distinct eras of growth.

Era 1: Agents (2018)

Compass’ first era -- 2018 -- is marked by an exponentially growing agent base after raising an unprecedented amount of venture capital.

The era kicked off in November and December of 2017, when Compass announced a massive $550 million capital raise. Subsequent to that, it announced an additional $400 million raise in September 2018. All told, Compass raised nearly $1 billion in venture capital in less than 12 months.

 
unnamed.jpg
 

That venture capital fueled the growth of its agent count, which quadrupled from around 2,000 agents at the beginning of 2018 to 8,000 agents by the end of 2018. Compass also embarked on a brokerage shopping spree, acquiring 12 seperate brokerages during the year. Over 40 percent of Compass’ agent count growth, or 2,563 agents, came from those brokerage acquisitions.

 
unnamed-1.jpg
 

Era 2: Tech (2019)

In the same way Compass’ first era was all about agents, its secord era was all about tech. Compass has always been a self-styled “tech-enabled” brokerage or “real estate tech company,” but it was not until 2019 that the company’s investment truly matched its rhetoric.

The era started in December 2018 with the hiring of a new CTO, Joseph Sirosh. Prior to Compass, Joseph was the CTO of AI at Microsoft. His hiring signaled Compass’ intent to move into the technology big leagues, and kickstarted an active 2019.

Compass wrote several large checks in 2019 when it acquired real estate CRM company Contactually in February and AI company Detectica in November. Both companies, with 21 and five tech employees respectively, bolstered the company's growing tech resources.

Compass’ tech team exploded (in a good way) during 2019, growing to a team size of 451 by the end of the year -- up 3.3 times from 138 at the start of the year. As a percentage of total full-time employees (FTE), tech staff increased from 10 percent to 22 percent, a significantly large portion of the company.

 
unnamed.png
 

Compass also opened a pair of new engineering centers during its era of tech. In September it launched a new 21,000 square foot tech center in Seattle for up to 170 staff, right across the street from Amazon’s headquarters. And in November, it opened an Indian tech hub, with intent to hire up to 200 staff.

In September, Compass also unveiled a new website, the culmination of many months of work and a critical prerequisite to its long term ambition of building an end-to-end software platform for consumers and agents.

Era 3: Making it Work (2020)

Which leads us to Compass’ current era: Making it all work. For Compass, 2020 must surely be about delivering on past promises, and successfully evolving from a brokerage into a tech-enabled brokerage. The stakes couldn’t be higher: Compass must justify its massive $6.4 billion valuation, which only makes sense if the company can harness technology to deliver an exponentially superior consumer and agent experience -- with associated productivity gains and scaling efficiencies.

To date, Compass has yet to definitively deliver on its promise of agent efficiency. The seeds were planted in 2019 -- its era of tech -- with a new web site, the acquisition of Contactually, and a massive tech hiring spree. With fuel in the tank, all eyes are on execution for 2020.

CEO Robert Reffkin’s annual company letter perfectly sums up the company’s strategic intent: “In 2020, we are going to align the whole company around the singular goal of growing your business.” Growing the agent’s business means one thing: closing more transactions.

Closing more transactions comes down to higher efficiency and productivity, which can only be manifested through technology. To deliver on this promise, Compass must deliver more leads to its agents, while enabling them to close more deals with less work in a shorter period of time.

The foundations have been laid in 2018 and 2019. The key question is: Can Compass make it all come together in 2020?

The Zillow Revenue Growth Fallacy

Conventional wisdom is that revenue growth is good, and is an important benchmark to measure a company’s success. But total revenue and revenue growth are misleading metrics for iBuying; they’re simply a proxy for how much capital the company has available to purchase houses. 

To increase revenue, Uber needs people to request rides, Airbnb needs travelers to book stays, and Netflix needs consumers to subscribe. iBuyers simply need to buy more houses, and the more houses they buy, the more houses they sell. 

It takes no great skill to enter a market with a lot of money and start buying houses. But it takes a great deal of skill to resell those houses and generate a profit.

Zillow is currently losing money on each house it buys and resells. Overall losses in its Homes segment (Zillow Offers) are mounting: a $100 million net loss in Q4 2019, and a $312 million net loss in 2019.

 
227ed4a8-a2c5-4124-ba0b-a122498d833d.png
 

Looking at the unit economics of each home, which includes the purchase price, sale price, agent commissions, interest expense, holding and renovation costs, Zillow lost over $6,000 per home it purchased and resold. That number has fluctuated over the year, but is rising.

 
792e2ea2-2966-459a-8c10-a92ccf41c997.png
 

(What's driving the loss? Since Q1, the average holding cost per home is up $1,000 and the average interest expense per home is up $1,000 -- both signs that it's taking longer to resell homes.)

After all business expenses are factored in: sales and marketing, technology development, employee salaries, office space -- everything -- Zillow is losing $56,000 for each home it purchases and resells.

 
37c8c3ed-1b9e-4295-8812-daf4664ceb28.png
 

Zillow’s entry into the iBuyer market is still in the early stages. The fact that the business is unprofitable should come as no surprise. The hope -- and it is really just hope at this stage -- is that profitability will come with scale and adjacent revenue streams like title insurance and mortgage.

What’s unclear is not Zillow’s strategy nor rationale for being an iBuyer. Rather, it is why Wall Street, or any other investor or media outlet, is rewarding Zillow for “beating” its revenue guidance. Not only is Zillow able to generate revenue at will by buying more houses, it loses more money with each house it buys. In effect, Zillow is being rewarded for losing more money than originally planned.

The Real Story: Premier Agent Growth

What Zillow should be rewarded for is bringing its Premier Agent Program back to growth. After a precipitous decline in 2018 and all growth grinding to a halt earlier this year, the program is back to growth mode -- albeit small. 

 
8cd65719-fce0-4cdb-bea0-8753941d45fb.png
 

Time will tell if Premier Agent growth will continue as Zillow continues to roll out its flex program, but the early signs are encouraging.

Choose Your Data Carefully

Zillow is investing heavily to grow a new business line, and its ability to sustain losses is reflective of how big it sees the opportunity. My hope -- and it is really just hope at this stage -- is that more sophisticated industry observers will stop putting so much emphasis on pure revenue growth as a metric for success.

Purplebricks’ Market Share Ceiling

Purplebricks’ H1 2020 financial results highlight a business whose growth has clearly plateaued and reached maturity in the U.K. The company appears to have reached peak efficiency, putting a ceiling on its future growth prospects.

Financials: Profitable, But No Longer Growing

Purplebricks’ revenue growth in the U.K. has effectively stopped. Total revenue is down from the same six month period last year, and the overall growth picture has gone from growth in 2018 to a plateau in 2019 and 2020.

 
bc836e7d-d26d-4e9e-ad74-68e3d9cef9b7.png
 

Purplebricks’ U.K. business is still profitable, which is becoming a rarity in the world of real estate tech brokerages. Other high-flying overseas disruptors, like Redfin, Compass, and Opendoor — which have raised billions of dollars and are grabbing market share from traditional incumbents — are all unprofitable.

The fundamentals of the Purplebricks business model are sound, with demonstrated profitability, but it has clearly hit a glass ceiling in terms of market share. Its number of customers, as measured by "instructions to sell," has remained flat over the past two and a half years.

 
178f58b4-8576-426d-b03a-0feddd1554d3.png
 

Purplebricks remains a business that scales linearly based on money (marketing costs to acquire customers) and people (local property experts to service those customers).

Marketing ROI

One key to the Purplebricks business model is efficient marketing spend at scale. On a positive note, its marketing return on investment (ROI) has bounced back up in the most recent six months. Each £1 invested in marketing returned £3.8 in revenue.

 
4b49a417-5e93-477b-b235-df1877128101.png
 

By way of comparison, Redfin had a marketing ROI of 9.8x in 2018 and 5.9x in the first nine months of 2019 — significantly higher than Purplebricks. This is a reflection of the value of Redfin’s popular consumer portal; having tens of millions of visitors browsing listings helps the brokerage acquire customers at a relatively low cost. (Last week I wrote about the difficulty — and incredible competitive advantage — in building a large consumer audience.)

 
0605ec75-0bcc-44ce-8ba8-766547c975e7.png
 

Overall customer acquisition cost (CAC) has also remained relatively flat, at around £375 per customer. This number really hasn’t changed much in over three years. The small fluctuations suggest a business model that has reached peak efficiency for customer acquisition — again highlighting a limiting factor in growing market share.

Gross Margins

Purplebricks is a business with a novel operating model. It has managed to change how traditional estate agents are compensated, with a structure more similar to Uber than a traditional real estate brokerage. As a result, its gross margins, 64 percent, are top of the industry. (For more on this, check out Inside Compass — Part 5: Endgame.)

 
1b1dcbcd-6d13-4b4b-9419-b5fa70f12aa9.png
 

Industry Average: REAL Trends U.S. reporting, Redfin: Brokerage Services Only, Compass: author's estimates.

Lessons Learned

I continue to use Purplebricks as a case study of successful disruption in my university course on real estate tech. Going from an idea to the largest estate agent by market share in the U.K., with a profitable business model (in the U.K., at least), is impressive and worthy of study.

In the U.K., Purplebricks succeeded where every other hybrid agency failed: by scaling. While its competitors slowly went out of business while failing to demonstrate a path to profitability, Purplebricks — partially through sheer force of will and spending power — managed to scale to the point of profitability.

But while Purplebricks managed to cross that first chasm, it never really made it over the next one: becoming a platform. The business still scales linearly based on marketing spend and people; I've yet to see evidence to support a credible path to double-digit market share. In the U.K., this may be as big as the business can get — a high-water mark for the hybrid agency model.

A Real Estate Portal's Path to Market Power (A Zillow Case Study)

Zillow’s drive to dominance in the greater New York City real estate market — via rental listings on StreetEasy and its hyper-local Hamptons portal Out East — reveals the path to market power of real estate portals around the world.

The Path to Market Power

All real estate portals follow a simple formula for national domination: acquire listings, build consumer traffic, and monetize. Comparatively, the first step is easy, the second hard, and the third inevitable.

 
ec1c00d2-3ef5-4d16-8cfe-10d28950e510.png
 

Building a huge consumer audience and achieving traffic dominance — which can take a decade — is the critical step. After that step comes power: The power to monetize, the power to push out competition, and the power to force adoption of your platform by recalcitrant customers.

(Upstart portals, such as OnTheMarket in the U.K. and Bomero in Sweden, don’t seem to fully recognize the difficulty of building traffic dominance — frequently believing that “if you build it, they will come.” The importance of acquiring listings is overstated while that of building traffic understated.)

Battleground New York

Zillow acquired StreetEasy, New York City's leading real estate portal, in 2013. Four years later, it announced it would begin charging for rental listings: $3 per listing per day. The rationale was that it would enable StreetEasy to "continue to fuel innovation, technology and resources to support a robust rental marketplace,” but it was also the inevitable outcome of achieving listing and traffic dominance in the market.

The pricing change caused a drop in listings — by some accounts, more than half — but StreetEasy still had the most listings and, more importantly, traffic dominance. This dominance allowed StreetEasy to announce a fee increase of 50 percent to $4.50 per listing per day in 2018. And again a year later, in 2019, StreetEasy announced a fee increase to $6 per listing per day.

 
40031637-6a86-43de-a457-10ac3949ddcc.png
 

There’s a fantastic, self-correcting system at play here — call it a free market — where the platform keeps increasing its prices and its customers keep paying, as long as there’s a positive return on investment. While price rises never feel good, it's hard to argue with, or effectively replace, the advertising reach a portal provides.

Monetization Strategies

Real estate portals around the world employ differing monetization strategies. Outside of the U.S., portals act as the de facto multiple listing service (a national database of all properties for sale) and monetize on a pay per listing basis. Within the U.S., Zillow has adopted both pay per listing (StreetEasy rentals) and, where a multiple listing service is already in place, pay per lead (Premier Agent).

Both strategies have their advantages. In some countries, the average revenue per listing can be thousands of dollars, while the price of a lead can range between $50-$100. The U.S. portals, Zillow and realtor.com, are pushing out a new, success-based fee structure in favor of pay per lead (read my analysis here).

Out East

While the battle for rental listings is well-advanced in New York City, the struggle is at an earlier stage for Zillow’s hyper-local portal in the Hamptons, Out East. Launched in 2018, Out East is in the early stages in the path to market power: acquiring listings and building traffic.

A group of local brokers launched a competing portal, HamptonsRE.com, to challenge the dominance of Zillow and Out East. While not seriously threatened (HamptonsRE.com only has 1,800 listings vs. 2,500 at Out East), it is a critical time in the path to market dominance.

Zillow’s recent decision to move from a pay per listing subscription to a free model for agents is a step backwards in its monetization journey. But it is only a tactical retreat designed to give Zillow a long-term, strategic advantage. Any by allowing agents to post new listings directly — for free — Zillow's move effectively circumvents the brokerages and handicaps their portal.

Key Takeaways

Viewed through a strategic lens, the moves and countermoves in the New York market highlight a number of key takeaways:

  • Traffic is king. Once traffic dominance is achieved, there’s really no stopping a portal from moving down the monetization path at will.

  • Play the long game. In the Hamptons, Zillow’s power gives it the ability to turn off an existing revenue stream in order to solidify its market position for the long term, with the inevitable monetization coming later.

  • Consumer first. An interesting observation: when brokers band together to launch a competing portal, they rarely talk about the consumer. To wit: "The impetus for the site was to create something that’s owned by the brokers." These are companies launching products that are good for themselves, not consumers.

Mike DelPrete: 2019 in Review

Amazing things happen when you combine a thirst for knowledge with an industry hungry for change. In 2019 I published a massive amount of original, evidence-based research in real estate tech -- and worked with a growing, receptive group of industry executives, mainstream media, investors and founders.

I'm grateful for the opportunities the year has brought me and for the personal connections created. I've made many friends (and antagonized a few people I'm sure). I truly value the intellectual challenge of what I do, and enjoy being at the nexus of the massive changes occurring across the real estate industry.

My 2019 Highlights

Three Major Reports

I released the industry-leading, 160+ slide iBuyer Report, a 35-page strategic analysis of Compass, and a comprehensive research study of iBuyer offer quality.

Keynote Presentations

I delivered a number of "wildly insightful and incisive" presentations, from conference keynotes to intimate executive retreats. Check out iBuying Disrupted: Battle of the Behemoths from Inman Connect.

Media Coverage

My research and analysis was covered in the Wall Street JournalNew York TimesBloombergCurbed, the Australian Financial Review, and others. Plus I was on NPR's Marketplace, twice.

Strategy Consulting

I worked with a select group of companies around the world, helping them understand the changes occurring in real estate, crafting growth strategies, and connecting them with partners, investors, and investments.

Real Estate Tech 101

I had the pleasure of ushering the largest group of students yet through my class on real estate tech at the University of Colorado Boulder.

Looking Ahead

Last year a reader said I was "the most reliable source for data-driven, strategic insights in the industry." That's my North Star. I'm looking forward to harnessing my curiosity, creativity, and industry connections in the year ahead to do my best work yet. Thanks for supporting my work -- 2020 should be a blast!

Property Portal Pricing Is Irrational (A Case Study)

I’m selling my house in New Zealand. As part of the process, I'm advertising the property on the major property portals as well as Facebook and Google. It's a perfect opportunity to evaluate the pricing and performance of the various advertising channels, and reveal -- in a real world scenario -- how irrational the system can be.

Background

In New Zealand there is no MLS system that has all properties for sale. That job falls to the real estate portals, and the business model of those portals is pay-to-list. New Zealand (in addition to Australia) is also a vendor-funded marketplace, meaning the homeowner pays the advertising costs, not the real estate agent. And for this transaction, I'm using a Tall Poppy real estate agent, the company where I’m an independent director.

Cost per Channel

When listing my house, I was presented with several advertising options. Trade Me (where I used to work) is the leading real estate portal and realestate.co.nz is the #2 portal. Facebook and the Google Display Network (GDN) are alternative advertising options, and in the world of real estate portal strategy, I’m curious to evaluate their effectiveness (i.e. are they truly competition to the portals?).


There is a significant cost difference between the #1 and #2 portal; Trade Me is over five times more expensive, but is it five times as effective?

Clicks to Listing

The easiest measure of advertising effectiveness are clicks to the property listing. In this case, as is the case with many real estate portals around the world, the top portal is absolutely dominant. At the time of analysis, Trade Me generated over 10 times the clicks to my property listing than the runner-up portal -- 3,100 vs. 300.


(It's worth noting that the Tall Poppy web site generated more clicks for my listing than the #2 portal, reinforcing the continued importance of a real estate agent's web presence to advertising listings.)

Cost per Click

To measure the overall cost effectiveness of the advertising options we review the cost per click.


Trade Me, the top portal, is not only the most effective but also the most cost effective -- by a wide margin. While Trade Me is over ten times more effective than the runner-up portal, it is only 5.5 times more expensive.

Assigning a value per click of $0.30 (the blended average), Trade Me delivered $936 of value for $549, while the runner-up portal only delivered $89 of value for $99 -- a negative return on investment.

It turns out that Facebook is a legitimate advertising channel, but it doesn’t come close to replacing the portals as the primary advertising channel -- in terms of clicks and cost effectiveness. GDN is simply not cost effective.

Findings

Real estate, and real estate advertising, is a non-rational system. Decisions are made based on emotions, not facts. And this transfers to the world of real estate portals and pricing strategies.

A portal's pricing doesn’t always align with its effectiveness. There are more systems at play that influence -- and restrict -- a portal’s pricing strategy, namely the risk of alienating customers by aggressively raising fees, and pressure from competitors.

For the time being, the top portal in each market -- Zillow, Rightmove, REA Group, ImmoScout, Trade Me -- commands a dominant position. Being the place where "everyone goes to search for property," even with alternate options, most often yields exponentially more effective results than the competition.

Do iBuyers Like Opendoor and Zillow Make Fair Market Offers?

This research study addresses a fundamental question in real estate: Do iBuyers like Opendoor and Zillow make fair market offers on the homes they purchase? This has been a point of contention since the iBuyer business model launched, with opponents claiming that iBuyers purchase houses at well below market value, while iBuyers claim they provide consumers fair market offers.

To provide a definitive answer, this comprehensive study is both deep -- reviewing over 20,000 iBuyer transactions -- and broad -- utilizing multiple methodologies to draw insights from the data. The evidence suggests a clear answer to an often confusing question.

Methodology and data

This study uses three methodologies to establish an evidence-based view of iBuyer offers relative to market value:

  1. Purchase Price-to-AVM

  2. Price Appreciation

  3. Rejected Offer vs. Market Sale

The data consists of over 20,000 iBuyer transactions conducted in 2018 and 2019 where an iBuyer purchased and then resold a property. The transaction data is sourced from public records, which are the legally required disclosures on any property transaction. Multiple sources were used to establish consistency, and thanks go to Remine and ATTOM Data for making their unique expertise and data sets available.

The data used is not merely a sample; it is comprehensive, covering over 95 percent of relevant iBuyer transactions. The study includes over 60 different legal buying entities that iBuyers use to purchase homes. While all major iBuyers were tracked, this analysis focuses on the leading two: Opendoor and Zillow, which account for 86 percent of total iBuyer volume.

Method #1: Purchase Price-to-AVM

Purchase Price-to-AVM is a straightforward comparison of the price an iBuyer pays for a house and what an AVM (automated valuation model) determines a house is worth at the time of purchase. This study uses the First American AVM.

A review of the transactions undertaken by Opendoor and Zillow between January and September 2019 reveal a median Purchase Price-to-AVM of 98.6 percent, or $3,800 on a $270,000 home.


(For those interested, transactions in 2018 reveal similar results +/- 0.1 percent. I am focusing on 2019 because in a rapidly changing industry, the most recent transactions best reflect the current practices of each business. Zillow was in start-up mode in 2018.)

The Purchase Price-to-AVM also varies by market, with consumers getting offers closest to AVM in the three Florida markets of Tampa, Orlando, and Jacksonville.


While an AVM is not a definitive proxy for true market value, like a Zestimate, it is a data point and does provide helpful context in determining the fair market value of a house. The outliers are most likely problems with the AVM, rather than an iBuyer purposely over- or under-paying for a house by a significant margin.

Method #2: Price Appreciation

Price appreciation is the difference between what an iBuyer buys and subsequently resells a house for. Each of these “flips” occurs within a short time frame (typically 90 days). The difference between these two numbers reveals clues around the market value for a house.

A review of the transactions where Zillow and Opendoor purchased and then resold a house in 2019 reveals a median price appreciation of 3.3 percent, or $8,900 on a $270,000 house.


In 2019, the average annual home price growth is 3.8 percent, according to Black Knight. Assuming an average holding period of 90 days, that’s 0.9 percent of price appreciation that naturally occurs in the market. Subtracting this from the 3.3 percent median price appreciation leaves 2.4 percent associated with the purchase and resale of the house.

The remaining 2.4 percent price appreciation delta is not solely a discount to market value; it must also account for the improvements made to each home. It’s reasonable for iBuyers to command a premium on the houses they own and resell, in the same way a certified pre-owned car commands a premium. These houses have been through a rigorous repair process with new carpets and paint, and refurbished up to a generally high standard.

Zillow’s per home renovation and repair costs are $12,000 (source: Zillow’s third quarter 2019 shareholder letter). Opendoor’s average average repair cost is between 2–2.5 percent of a home’s value. In each case, a significant amount of money is being invested into each home before resale, which should theoretically and practically lead to a higher home resale value.

Therefore, if we subtract the price appreciation that naturally occurs in the market (0.9 percent) and assume that half of the remaining price appreciation delta is a relative discount to market value when an iBuyer purchases a house, and the other half reflects a resale premium, the actual discount to market value is 1.2 percent (half of 2.4 percent), or $3,200 -- very similar to the 1.4 percent discount derived from the Purchase Price-to-AVM methodology above.


Price appreciation over time

Price appreciation is a fluid metric, and is changing over time and by market. On a yearly basis, the median price appreciation delta has dropped from 5.2 percent in 2018 to 3.3 percent in 2019. And it’s not simply a factor of iBuyers moving into more expensive markets; in absolute dollar value, the median price appreciation dropped from $12,300 in 2018 to $8,500 in 2019.

 
Screen Shot 2019-11-09 at 2.34.44 PM.png
 

The trend continues in 2019. On a monthly basis, median price appreciation has dropped a full percentage point between January and September of 2019.


The resulting trend is clear: iBuyers are making less and less money on the “flip” of a house.

There are a number of reasons for this trend. The iBuyers have always publicly stated that they aim to offer consumers a fair deal, with no desire to buy low and sell high. The iBuyers are attempting to make offers as close to market value as possible, and are improving over time.

The change also reflects increased competition in the space. With Zillow launching its home-buying program in 2018, competition is heating up in a major way. Both Opendoor and Zillow are attempting to grab market share as fast as possible, and one way to do that is by offering more attractive offers to consumers. 

Median price appreciation varies by market, and could be an artifact of overall market appreciation, iBuyer market maturity, or local competitive pressures.


Method #3: Rejected Offer vs. Market Sale

Many consumers request an iBuyer offer, but not all accept it. Of those that request an offer, reject it, and then go on to sell their home traditionally, it is possible to track the difference between the original iBuyer offer and the eventual sale price.

A recent Zillow study looked at 3,200 homes where a seller declined a Zillow Offer and then went on to sell traditionally within 120 days. On average, Zillow was offering 99.8 percent of the eventual sale price -- an implied discount of 0.2 percent.

The Zillow statistic has not been verified by an independent third-party and its comprehensiveness is unclear. Even so, it is a useful data point in this analysis. Opendoor declined to discuss its metric for this study.

Summary of evidence

The evidence in this research study strongly suggests that iBuyers are offering close to fair market value for the homes they purchase. Multiple methodologies based on independent, third-party data suggest a discount to market value of around 1.3 percent -- or $3,500 on a $270,000 house.


It is important to remember that this is the median. In any statistical study, there will be outliers, examples of homes where the discount to market value is higher or lower.

Total cost to the consumer

Whether iBuyers make fair market offers on houses is a different question than if iBuyers make fair offers to consumers. To answer the latter question -- which is not the focus of this study -- all of the associated costs and fees need to be included.

The average iBuyer fee is around 7.5 percent -- 1.5 percent higher than a typical real estate commission. However, the average holding costs for three months (which can range from 1–2.5 percent of a home’s value) shift from the consumer to the iBuyer, making the true cost difference negligible.

Which leaves the discount to market of 1.3 percent, or $3,500 on a $270,000 house, as the primary monetary difference between an iBuyer and a traditional market sale. Ultimately, it is up to consumers to decide whether that discount -- in exchange for convenience, speed, and certainty -- is worth it.

Strategic implications for the industry

So what is revealed about a business that buys and resells houses, but doesn’t make money on the flip? Buying houses is a means to an end. But what is the end, and how will iBuyers make money?

The answer is that it’s not about the house, it’s about the transaction. And iBuyers can make money through ancillary services like mortgage and title, and in Zillow’s case, seller leads. This should concern any mortgage and title incumbent; iBuyers are your new competition. And to maximize consumer adoption of these new services, iBuyers must control the transaction, and the expert advisor in the transaction: the real estate agent.

The results of this study -- that iBuyers are buying homes at close to market value -- is seemingly positive for consumers. But long term, to fulfill their strategies and build a viable business that makes money, iBuyers will need to operate walled gardens under their control: Sell to an iBuyer, buy an iBuyer home, finance with an iBuyer Mortgage, and use an iBuyer Agent. And this exclusive, closed ecosystem will likely have a significant impact on the real estate industry going forward.


Download this research study as a lovely, nine-page PDF.


Transparency And Deception In Real Estate Tech Fundraising

Transparency is the cornerstone of any successful, trustworthy business. But not all real estate tech companies practice transparency; the most egregious example occurs in fundraising. The lines between raising equity and securing debt have been blurred, and numbers are being inflated in an effort to mislead the public. If a business model relies on deception, it’s a bad business model.

Equity vs. Debt

A company raises equity and secures debt.

When a company raises equity funding, it sells investors stock in exchange for capital; investors are buying part of the company at an agreed-upon valuation. When a company secures debt, it is granted a line of credit to access funds when needed, or is given a loan -- both of which need to be paid back, with interest.

With the rise of iBuyers and similar models that involve a strong financial component, such as purchasing homes directly from homeowners, debt requirements are skyrocketing. Many real estate tech companies, some of which are barely a year old, are securing hundreds of millions of dollars in debt.

Debt is not equity

As far back as I can recall, when a company announced that it had raised money, it was talking about equity investment. An investor had reviewed the business pitch, decided the model and the team were winners, and invested money into the venture in exchange for stock.

At some point, things changed. When raising money, it is becoming increasingly common for real estate tech companies to combine equity and debt together into a larger, more impressive sounding number.

Because companies are using debt to finance the purchase of homes, the amounts are absurdly large. In fact, the companies that combine equity and debt are, on average, artificially inflating the amounts raised by 11 times!


This is a deceptive practice meant to trick the public into thinking a company has raised more money than it actually has, and is bigger and more successful than someone may otherwise think.

Debt is not equity. If I get a $500,000 mortgage to purchase a new home, have I “raised $500k to reinvent the home buying process for my family,” or have I simply secured a loan (which must be repaid)?

Best (and worst) practices

Some companies unapologetically combine equity and debt numbers and refuse to reveal the breakdown. Others combine equity and debt as a headline number, but eventually reveal the breakdown later in a press release. Artificially inflating the headline number is still deceptive, but at least they’re not brazenly hiding the truth.


The best practice -- and the most transparent -- is talking about equity as equity, debt as debt, and not inflating the headline number by combining the two.

Transparency in action

Full credit to the two biggest iBuyers, Opendoor and Zillow, for providing full transparency around capital raises. As a public company, Zillow really has no choice other than to play by the rules. Opendoor, as a private company, is not forced to offer the same level of disclosure, but nonetheless chooses to in a commendable effort of transparency.

Ribbon and Knock are two of the worst offenders, with the following big-money, attention-grabbing headlines: “One-year-old Ribbon raises $225M to remove the biggest stress of home buying,” and “Knock Raises $400M To Simplify Home Buying.” Unfortunately, each raise includes massive amounts of debt and neither company reveals the actual numbers (in Knock’s case, public filings later revealed the equity component was $26 million).

EasyKnock, Nested, Flyhomes, Homeward, and Perch are all guilty of combining equity and debt into large headline numbers, and then go on to clarify the figures in the body of the announcement -- but the damage has already been done.


Offerpad used to break out equity and debt, but is now combining both into a large, headline figure and not providing the details. Like the others, the results are impressive headlines that confuse and mislead the public -- especially when compared against peers, like Opendoor, that aren’t inflating their numbers.

Comparing apples and oranges

The issue becomes clear when making comparisons -- often while someone is attempting to make a decision. Whether it’s a prospective customer, a potential employee, or a curious journalist, misleading headlines create unfair and inaccurate comparisons.

For instance, if one compares the headline numbers from Opendoor’s $300 million raise with Knock’s $400 million raise, Knock may appear to be the fundraising winner. However, in reality, Opendoor raised over ten times the amount of equity than Knock: $300 million vs. $26 million! And in total, Opendoor is even further ahead.


Getting noticed

I imagine a number of companies -- many of them run by friends and colleagues -- undertake this practice to appear larger than they actually are. But I also imagine that in real estate, a factor even more important than fundraising prowess is trust. And trust comes through transparency. If your business model relies on deception, it’s a bad business model.

Do Compass and Opendoor Have A WeWork Problem?

On its path to a now-delayed IPO, SoftBank-backed WeWork’s valuation has fallen from $47 billion to somewhere between $10 billion and $15 billion. This precipitous drop appears to be a collective repudiation of not only WeWork’s business model and SoftBank’s valuation philosophy, but of the inverted economics of big money unicorns without a path to profitability.

WeWork’s valuation challenges highlight the potential issues that SoftBank’s other real estate investments—namely Compass and Opendoor—may face in their march towards IPO.

Strong growth, fueled by capital

WeWork shares a number of traits with Compass, a real estate brokerage, and Opendoor, an iBuyer: They all deal in real estate, have raised massive amounts of capital from SoftBank at multibillion dollar valuations, and are growing incredibly fast. All three are unprofitable, pay most of their revenues away as a cost of sale, struggle with their identity as a tech company, and, in the case of Compass, have a profitable, publicly traded rival that is valued far less.

Compass’ business model is fueled by capital. It has raised more than $1.5 billion, which it is using  to acquire brokerages and recruit agents at an unprecedented scale. It is turning dollars into agents, which in turn generate revenue.


Opendoor has raised over $1 billion—more than 10 times its nearest competitor—and has used that capital to fuel a rapid national expansion (in addition to launching a mortgage venture and acquiring a title company). Opendoor is on track to purchase around 17,000 homes in 2019.


When a company raises such large sums of capital, there is only one possible exit: an IPO. The other path—an acquisition by another company—is priced out of the equation due to the massive valuations involved; other companies can’t afford the transaction. Case in point: Compass’ $6.4 billion valuation is on par with Zillow and nearly four times higher than Redfin.

When selling my company years ago, a trusted advisor told me that a business is worth what someone else is willing to pay for it. SoftBank is certainly guilty of testing the upper bounds of private company valuations, and the WeWork episode makes it clear that what SoftBank is willing to pay for a company is quite different than anyone else.

Justifying a sky-high valuation

Both WeWork and Compass have profitable, publicly traded rivals that are valued far less (IWG for WeWork and Realogy for Compass). In the case of WeWork, “IWG has substantially more square footage and more customers, and has actually made a profit—yet its market cap is just 8% of what SoftBank’s latest funding round thinks WeWork is worth,” according to Recode.

The Wall Street Journal examines why WeWork is struggling to sell its story to investors, and sums up the narrative as follows:

  • WeWork’s revenue is growing fast, but so are its expenses.

  • WeWork’s operating losses are keeping pace with its revenues.

  • WeWork is raising increasingly large sums—but has yet to announce a profit.

  • And a profitable, publicly traded rival is valued at far less.

In 2018 (the last full year where complete information is available), Compass’ publicly traded rival, Realogy, had 42 times the number of transactions, 11 times the sales volume, seven times the revenue—and actually made a profit!—but an enterprise valuation on par with Compass.

WeWork, Compass and Opendoor have valuations that are pegged to their impressive growth rates, but when that growth is dependent on having and spending vast sums of money in an unsustainable manner, it’s difficult to justify.

Impact on Compass and Opendoor

If the pressure from the public markets continues to push for profitability, it may accelerate (or force) a change in the operating economics at Compass and Opendoor, which up until now have fueled their massive growth with massive expenditures.

A drive to increase revenue could lead Opendoor to raise its fees, or Compass to reduce its generous commission splits with agents; either move would severely limit growth. Reducing expenses would come in the form of office consolidation (Compass has over 250 offices across the U.S.), ratcheting down employee perks, or even staff layoffs.

(Uber, another one of SoftBank’s investments, recently announced a round of layoffs from its product and engineering teams: 435 people, or 8%of its entire workforce, were let go. This comes just a few months after Uber, whose stock is down over 20% since IPO, announced that it was cutting 400 employees from its marketing division.)

Stock options

Those most impacted at WeWork, Compass and Opendoor may end up being employees and contractors that have stock options. Compass, in particular, has used this as a key tool for agent recruitment and retention, and a dropping valuation would make those options worth a small fraction of what was initially promised.

In addition to stock options granted to induce agents to join Compass, those agents can also invest a portion of their commissions into the company. As of November 2018, more than 1,000 Compass agents had invested over $20 million into stock options.

And while Compass’ valuation isn’t dropping—it recently increased from $4.4 billion to $6.4 billion—the rate of increase is slowing.


Compass is not WeWork, and nor is Opendoor. But to succeed, all three businesses require an unprecedented amount of capital and a willingness to buy into a vision that is driven more by words than numbers and where the long-term validity of the business model is easier to assert than to prove.

The current WeWork fiasco (and to be clear, we’re talking about a 70% to 80% drop in value simply as a result of opening the books and being honest about the business) shows that valuations can’t keep rising unchecked by the realities of basic economic principles—and that investor patience does have a limit.

After U.S. Flop, Real Estate Brokerage Purplebricks Faces Mounting Headwinds In The U.K.

Tech-driven real estate brokerage Purplebricks released its 2019 results last week. After a failed U.S. expansion, the core U.K. business is still growing and remains profitable, but is facing headwinds in a soft property market. The results highlight the critical importance of scale and customer acquisition costs, and offer a reminder that tech-enabled platforms continue to command a rising percentage of the real estate transaction.

Profitable, but mounting headwinds

Purplebricks’ impressive growth in the U.K. market continues, albeit at a slowing pace. Overall instructions (or instructions to list) are up again, but only 9% compared to the previous year.


At this scale, the trend is unsurprising. As I said last year in this Financial Times article, “Real estate is very fragmented, there are relatively low barriers to entry to get into the business of selling houses, the products are undifferentiated and there’s no customer loyalty. That leads to natural fragmentation.”

Meanwhile, Purplebricks’ finances for the U.K. operation -- while up for the entire year -- have taken a hit in the most recent six months (December to April, 2019).


The decline is driven by a drop in revenue. Compared to the first six months of Purplebricks’ financial year, marketing expenses remained steady while revenue dropped £6.5 million. With a soft property market in the U.K., at least partially driven by the uncertainty around Brexit, it is becoming more difficult and expensive for Purplebricks to acquire customers.

For the first time in its history, Purplebricks customer acquisition cost (or cost per instruction) has increased from the previous year. The trend of increased economics of scale has taken a pause -- perhaps temporary, perhaps not.


Overall marketing ROI (defined as how much revenue each £ in marketing buys) -- while still nicely positive -- is down in the most recent six months.


A financial bloodbath in new markets

Purplebricks announced its departure from the Australian and U.S. markets earlier this year. At the time, international expansion was a key driver in Purplebricks’ stock price and investor optimism. But the latest results reveal what a financial bloodbath the moves were.

In 2019, Purplebricks lost nearly £19 million in Australia and £34 million in the U.S. A large part of this expenditure was expensive marketing. The reasons for the failure in international markets are complex, and range from not picking the right markets to ineffective marketing.

Gross margins and the platform play

A key highlight in Purplebricks’ results are a reminder of the market power it possesses, and more specifically, its high gross margins. A company’s gross margin is the amount of revenue it retains after paying its cost of sales, which for Purplebricks, are payments to its local property experts (aka agents).

In the U.S., average brokerage gross margins are around 15%. The outliers are Redfin and Purplebricks, whose novel operating models enable a standardized process with corresponding efficiency and economic gains for the company.


Purplebricks’ gross margins in the U.K. increased to 63%, up from 58% in the previous year. In other words, for each £899 listing, the agent keeps around $333 while Purplebricks retains £566 of the fee.

And in the U.S., Realtor.com’s $210 million acquisition of Opcity and Zillow’s new flex pricing product follow the trend, with both charging real estate agents around a 30% referral fee when a transaction closes. These are all examples of the core economics of real estate changing, with technology platforms commanding a higher percentage of the transaction.

Purplebricks’ continued -- albeit slowing -- growth in the U.K. highlights the importance of customer acquisition costs in the new world of hybrid and online brokers. Having fantastic technology and a great team will only get you so far; at the end of the day, massive advertising expenditures are required to reach scale, and then, profitability.

How serious are Zillow and Redfin about iBuying?

In the past year, two of the U.S.'s leading portals, Zillow and Redfin, have launched iBuyer businesses. Zillow's entry was, in part, a response to an existential threat to its business model, and much of the value it may derive is not from buying and selling houses at all, but by generating valuable seller leads (watch my video presentation). Which begs the question: How serious is Zillow about being an iBuyer?

Opendoor's 3x advantage

The best way to compare seriousness is actual market traction and purchase volumes -- putting your money where your mouth is.

In the first seven months of 2019, Opendoor continues to be the clear leader in the iBuyer space as measured by home purchase volume. Opendoor has purchased nearly 10,000 homes, around three times the volume of Zillow.

 
1cf2adb5-b7c0-46a2-abdb-ec4351101ef4.png
 

On average, Opendoor is purchasing around 1,400 homes per month (as an aside, a recent Opendoor commercial stated the company buys a home every 34 minutes -- or around 1,300 per month). Again, this number is about three times the volume of Zillow for the first seven months of 2019.


However, Opendoor's volume advantage is eroding over time as Zillow's activity accelerates. In January, Opendoor purchased 4.7x the volume of Zillow, but that is down to 2.4x in July. Zillow is closing the gap (especially in the last three months).

 
e7b38fb1-9ea5-4880-8f82-1e2435445ba8.png
 

The magic number in all of this appears to be 3x: year-to-date in 2019, Opendoor is about 3x ahead of Zillow in terms of home purchases. But Zillow is catching up.

Available firepower to purchase homes

Another way to judge a company's level of seriousness about iBuying is how much debt it has available to purchase homes. Each of the major iBuyers has secured massive amounts of debt, but some have secured more than others.


Once again, the magic 3x number appears: Opendoor has three times the debt available to purchase homes compared to Zillow. So it is no surprise that it is purchasing three times the volume of homes.

What about Redfin?

Readers may notice Redfin in distant fourth place in many of the charts, which, again, is an indicator of seriousness about iBuying.

Opendoor has 30x the debt available and has purchased nearly 40x the homes compared to Redfin in 2019. On average, Opendoor is purchasing around 1,400 homes per month, compared to Redfin's 36 homes per month. Redfin is an iBuyer in the same way I'm a basketball player. Both statements are technically true, but neither of us are anywhere close to the big leagues.

Differing strategies and motivations

Opendoor's entire business model revolves around buying and selling as many homes as possible. At scale, it becomes a powerful business. Zillow, on the other hand, may want to moderate its home purchases to achieve a scale where it maximizes seller leads. As I've said before, Zillow has the potential to make more money with less risk by monetizing seller leads.

Zillow's purchase rate (the amount of homes it buys compared to the total number of offer requests it receives) has consistently hovered around 2 percent.


Zillow is expanding fast to catch up to Opendoor, but it may have different motivations in doing so. Zillow's buying activity in Phoenix, for example, has plateaued since January of 2019. Is it taking a well-earned breather, or is 100 homes a month all it wants (or needs) to buy?


The evidence suggests that Zillow is serious about being an iBuyer and a major player in the space. But its motivations, and the question of why it wants to be an iBuyer, may differ significantly from other iBuyers.


Check out the part of my Inman Connect presentation where I talk about Zillow's pivot to iBuying, and the value of seller leads.

Is Compass no longer valued as a technology company?

A few weeks ago, Compass announced its latest funding round: $370 million at a $6.4 billion valuation, bringing its total funding to over $1.5 billion. This provides new answers to a familiar question: Is Compass being valued as a tech company or a traditional brokerage?

Turning dollars into agents

The chart below shows Compass' recent funding rounds and its growing agent count. As I said during my recent Inman Connect presentation, "Compass is turning dollars into agents."

 
Screen Shot 2019-08-16 at 2.12.29 PM.png
 

During Compass' recent funding announcement, it stated that revenue is 250 percent in the second quarter compared to Q2 2018 (or up 150 percent). The highlighted columns represent those two time periods. Compass' agent count in August 2018 was around 4,500, compared to 13,000 in August of 2019. Overall agent count is up 190 percent while revenue is up 150 percent.

Using that growth figure for the full year, which is generous but fair, Compass' 2019 revenue would be around $2.25 billion. A $6.4 billion valuation would imply a revenue multiple of 2.8x -- a significant drop from previous years. While agent count is up 190 percent and revenue is up 150 percent, valuation is up only 45 percent.


Tech company or brokerage valuation

One of the key questions I explored in my deep dive analysis of Compass is whether it is being valued as a technology company or a brokerage. At the time, it was clearly being valued as a technology company, with a revenue multiple of 4.9x -- well above traditional brokerages and much closer aligned to Zillow.


The updated chart below shows revenue multiples based on projected 2019 revenues and stock prices as of July 1, 2019. Zillow still leads the pack, while Compass is on the leading edge of the next rung of traditional and tech-enabled brokerages. On a revenue multiple basis — and compared to 2018 — Compass is being valued less as a technology company and more as a traditional or tech-enabled brokerage.

 
Screen Shot 2019-08-28 at 9.46.30 AM.png
 

(Revenue multiples are just one way to benchmark company valuations. Even using other methods, such as a gross margin multiple, the story is the same: When using the same valuation methodology, Compass' valuation multiple is significantly lower than it was last year.)

Slowing growth?

Revenue multiples are generally based on future growth rates. One could argue that as Compass gets larger and its growth rate slows, its revenue multiple will naturally fall. However, Compass' growth in 2019 appears to be the same as it was in 2018: 150 percent. Compass' lower revenue multiple does not appear to be tied to a slowing growth rate.


Compass continues its impressive growth. Topping $2 billion in revenue would be quite an achievement, and its $6.4 billion valuation is massive. However, as the company approaches an IPO, it's worth noting the lower valuation multiple.

It would appear that investors are less bullish on the company. Either Compass' growth is expected to slow dramatically in future years, or the company is being valued more as a traditional brokerage and less as a high-flying technology company.


Check out my epic, five-part Compass analysis into an easy to read whitepaper. Now you can read all 35 pages in one document, print it out, and easily share with colleagues. Download the free PDF and enjoy!