Chess Without Checkmate: The Portal Wars


As 2024 draws to a close, it’s worth revisiting the Portal Wars in the U.S. – and how little has changed.

Why it matters: It’s a case study that illustrates two important lessons: hype is not the same as reality, and some games just can’t be won.

  • The potential disruptor is CoStar, which has invested over $1 billion in Homes.com to challenge the incumbent portals for dominance, with traffic growing alongside a massive advertising spend.


Yes, but: Corresponding revenue growth has slowed and pales in comparison to the established portals.

  • In the latest quarter, Zillow’s real estate lead gen revenue was about 20 times higher than Homes.com’s.


Zillow’s lead over the #2 portal realtor.com, as measured by real estate lead gen revenue, has remained relatively constant over time – and if anything, has increased.

  • The recent uptick could be a result of strength in a down market, Zillow flexing its Flex muscle, or just slower growth at realtor.com.
     

  • But the result is key: the #1 portal’s competitive position tends to get stronger over time.


The same scenario has played out in Australia and the U.K., where the leading portals command a significant revenue lead over their rivals.

  • Interestingly, that lead is similar in all three markets – an average of 3.3x and increasing over time.
     

  • The #1 portals stay strong and get stronger over time, the beneficiary of network effects, with no examples of that dominant position being eroded.


The bottom line: Real estate portal competition is like chess without checkmate; there’s no winning move, and it’s not a game that can be won.

  • There’s a flurry of activity, tactical moves, and strategic plans, but very little actually changes; traffic may increase in a non-zero sum manner, but revenue – the ultimate metric of delivering value to paying customers – remains competitively static.
     

  • Portal competition is exciting, but it’s unlikely to materially change the landscape – which is a perfect example of the DelPrete Probability Paradox in action.

Post-Settlement, Buyer Agent Commissions Remain Unchanged


All eyes are on buyer agent commissions after the NAR lawsuit settlement – which, so far, have remained unchanged.

Why it matters: The commission settlement changed the mechanics of buyer agency, giving consumers more choice with agents competing on value; the buyer agent commission is a reflection of that value.

  • This data is from the nation’s largest brokerages and represents about 55,000 closed transactions per month – or about 17 percent of the market.


Dig deeper: There has been no change in average buyer agent commissions since the settlement took effect in August 2024.

  • Historically, buyer agent commissions fluctuate based on a variety of factors including overall market conditions and seasonality.
     

  • For reference, the 0.06% annual decrease in the chart above equates to $245 on a median-priced, $409,000 home.
     

  • This data is national and figures will vary by market; the specific number is less important than the vector of change over time.


The bottom line: A big part of the commission lawsuits was about consumer choice; replacing a default path with more transparency and more choice around buyer agent compensation.

  • The evidence to-date doesn’t support the hype around this being a seismic shift in the industry – consumers still value a buyer agent the same as before.
     

  • It’s still early days and things may change in the future, but this is an important benchmark to set and an important foundational change for the industry.
Portals, Disruptors, and Investing for Mortgage Growth

Even in a depressed market, people are still getting loans and buying houses – and some companies are positioning themselves to capture a larger share of the mortgage market.

Why it matters: Tracking MLO (Mortgage Loan Originator) headcount is a corollary to the size of a company’s mortgage business, and tracking headcount over time reveals who is investing for future growth.

  • Three interesting examples are Zillow, Redfin, and Better Mortgage.
     

  • Over the past 15 months there has been slow and steady headcount growth at Zillow, an equally slow decline at Redfin, and a rapid rise at Better (a classic hockey stick curve).


Broadening the field of companies and looking at the past three years provides helpful context in terms of growth, decline, and relative size.

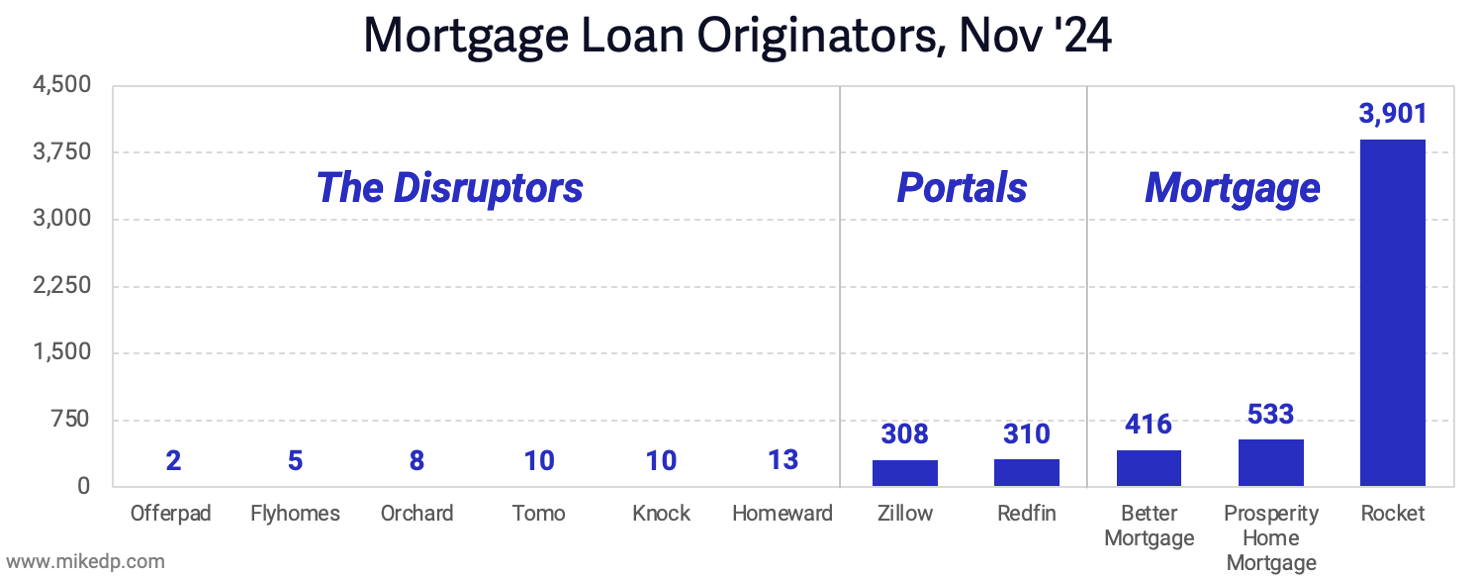
  • The small disruptors pale in comparison to the portals and established mortgage companies.
     

  • Better has been on a wild ride.

As a percentage, Better has grown the most over the past year. 

  • Tomo earns a noteworthy mention as the only disruptor to materially grow MLO headcount (but off a small base). 


Mortgage origination volumes typically align closely with MLO headcount.

  • Zillow’s origination growth has remained steady as it continues to invest in and grow its mortgage business.
     

  • Redfin and Better appear to be riding more of a seasonal wave. (Note: Better’s origination volumes also include a growing refinance business, while Zillow and Redfin are primarily purchase volume.)


The closest metric to measuring overall efficiency would be Origination Volume per MLO.

  • Zillow’s has been flat while Redfin experienced a recent uptick in the previous two quarters, the result of a seasonal uplift in volume with a corresponding drop in MLO headcount.
     

  • Better’s metrics were materially better, but have been sliding, likely a result of exponential headcount growth outpacing origination volumes (i.e. investing for future growth).


Revenue per MLO is another efficiency metric, and in that category Zillow is winning.

  • In Q3 2024, Zillow’s mortgage revenue per MLO was $130k compared to $114k at Redfin and $89k at Better.

The bottom line: The companies that can afford to are aggressively growing MLO headcount in order to capture future market share.

  • The mortgage businesses of the disruptors, primarily Power Buyers, remain at a much smaller scale as they've navigated the slow market and pivoted their business models.
     

  • The portals are the ones to watch – having acquired mortgage businesses of significant scale – and with Zillow continuing to grow its MLO headcount.
     

  • The pure-play mortgage companies are larger, especially Rocket, and well-positioned to execute on growth opportunities in their own adjacent spaces.

To Cumulative Or Not To Cumulative, The Pacaso Story


To me, the truth matters – and a recent example from Pacaso’s fundraising deck reveals the latest example of a company toeing the line between accuracy and what looks good

Why it matters: In Pacaso’s case, this is information that retail investors are using to make investment decisions – but more generally, this is about the importance of leading with transparency and accuracy.

Dig deeper: Pacaso recently revealed its financials as part of its crowdfunding campaign, a fascinating peek inside the operations of a high-flying and highly-funded real estate tech startup.

  • A point of contention in the release was the use of non-standard “cumulative” financials instead of annual: cumulative revenue and cumulative gross profit.
     

  • Making matters worse, the graphs were not labeled, giving the impression that the reader is being misled into thinking they are annual numbers.


Pacaso then updated these graphs, and, in a weird twist of fate, did so in a public Google Slides document that I happened to be viewing, producing a real-time feed of comments as they debated what to change. 

  • During this process, the team clearly evaluated a more traditional annual presentation of its financials, but ultimately decided to retain the cumulative charts because the annual ones “don’t look great visually.”

Ultimately, labels were added to the existing cumulative charts in the investor deck, but the same charts remain misleadingly unlabeled on the investor site (note: after first publishing this article, a label was added to the relevant graphs).


Pacaso is not alone; companies have been stretching the truth for years in order to tell a particular story or mislead investors.

  • The most common area is reporting profitability, where unprofitable companies have a tendency to highlight “gross profit” or “unit economics,” metrics which exclude many expenses like salaries and marketing (read more: iBuyers Turning Obfuscation of Profit into an Art Form).
     

  • Net Profit, EBITDA, and Adjusted EBITDA is another veritable minefield of manufactured metrics that tell a one-sided story, which is why I recently dug into Cash Flow as the ultimate profitability metric.


The bottom line: Information is power, and transparency is powerful – it’s easy to tell whatever story you want by subtly manipulating the display of data.

  • It’s one thing to mislead experienced investors whose job is to see through statistical illusions, but it’s another to mislead individual retail investors.
     

  • There’s a thin line between painting yourself in a favorable light and outright deception – there may be a short-term benefit, but the long-term consequence is the erosion of trust, arguably the most valuable factor for any person or business.

Portal War ‘24: What $1 Billion in Advertising Buys You


The biggest upstart real estate portal in the world, CoStar’s Homes.com, has comfortably settled into the #2 spot in the U.S. – but at what cost?

Why it matters: Homes.com is a real-time case study of what it takes for a portal to disrupt the status quo, and it appears to take $1 billion in advertising.

  • After a year of heavy investment, Homes.com has overtaken realtor.com for the #2 spot for two consecutive quarters.


Dig deeper: In May I asserted that portal traffic was a non-zero-sum game, meaning that traffic gained by one portal (Homes.com) is additive and not coming at the expense of other portals.

  • That trend continued into Q2, with the combined traffic of Zillow, realtor.com, and Redfin remaining the same as last year, while Homes.com significantly grew its traffic.


It’s not rocket science; Homes.com’s traffic growth is directly correlated to its overall advertising spend – which is how advertising works.

  • The steady increase in traffic during the first three quarters of 2023, the dip in Q4, and the big increase in the first half of 2024 tracks exactly with CoStar’s overall advertising spend.


Astute readers may notice that advertising spend is required to maintain traffic levels, revealing insights around overall advertising efficiency.

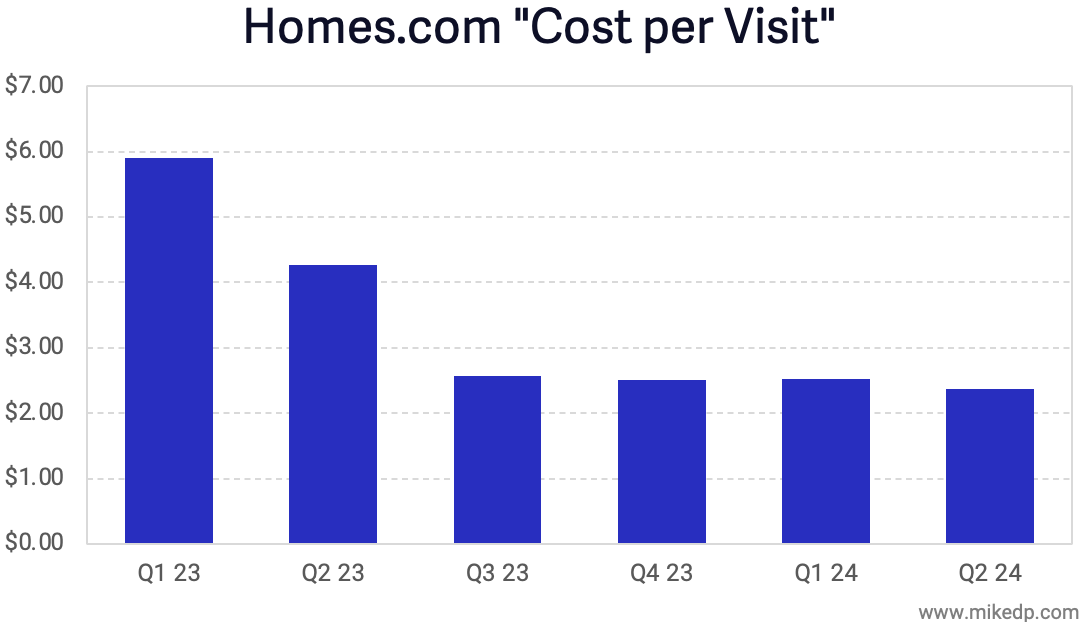
  • Dividing the overall advertising spend by the number of average monthly uniques provides a rough illustration of advertising efficiency over time (cost per visit).
     

  • Not all of CoStar’s advertising budget is going into Homes.com, but considering it was $55 million in Q1 2022 and $234 million in the latest quarter, it’s clearly a lot.
     

  • Directionally, this highlights that advertising efficiency isn’t meaningfully changing, traffic is not growing organically (yet?), and that, for the time being, continued advertising spend is required to maintain Homes.com’s traffic levels.


The bottom line: For years, disruptor portals have tried unsuccessfully to unseat market leaders around the world. 

  • Becoming the #2 portal has cost CoStar about $1 billion in advertising, but the real question is: how much will it cost to maintain that position (the current math suggests the answer is around $950M in advertising spend per year).
     

  • Homes.com is proving that changing the status quo is possible, if you have the cash.

Cash Flows of the Rich and Famous


Cash flows are in for the first half of 2024, and some companies are losing money, some are making money, and some are making a lot of money.

Why it matters: Operating cash flows are an accurate measure of business model health, and a data-driven analysis reveals insights around various models and market dynamics.

  • Operating cash flow is a metric that cuts through the hype to measure the actual profitability of the core operating business model: does it make money?

Dig deeper: eXp Realty, a real estate brokerage, and Zillow, a tech company and portal, both generated the same amount of cash – a surprising result given the very different business models.


Industry incumbent Anywhere has moved away from being a big cash generator, likely a result of the challenging market; its business model is less resilient.


Meanwhile, eXp Realty has grown its cash generation abilities during the same period of time – and in the same market conditions.


Adding real estate portals from around the world – Germany’s Scout24, the U.K.'s Rightmove, and Australia’s REA Group – reveals just how profitable those businesses are.

  • Rightmove and REA Group are the most profitable real estate portals in the world.


Considering market size, as measured by population, when comparing real estate portals reveals a thought-provoking data point.

  • Real estate is similar around the world, but market dynamics and business models are very different, as highlighted by operating cash flow per capita (per capita means “per person”).


REA Group is world-class in its ability to monetize its market – with an operating cash flow per capita 16x higher than Zillow.

  • Australia is the market that CoStar points to when talking about its monetization plans for Homes.com.
     

  • But the markets are very different: Australia doesn’t have MLSs and has vendor funded advertising (for more, check out my Real Estate Portal Strategy Handbook).


The bottom line: The market is tough but it doesn’t mean all businesses are struggling, and real estate portals remain some of the most profitable businesses in real estate.

  • The U.S. market is huge, but market size does not always correlate to profit potential – it has more to do with local dynamics.
     

  • In the end there will be winners and losers – companies generating cash and burning cash – which is an accurate reflection of business model efficacy.

Secret Shopping: 47% of Online Property Inquiries Are Ignored


This report presents the results of 100 secret shops in real estate, a strategy used to evaluate a business's services, products, and real customer experience.

Why it matters: The results highlight significant areas of opportunity for brokerages and agents in the fundamentals of customer service.

The research: We conducted over 100 secret shops across the U.S., managed by a team of experts who used a standardized method conducted in a professional, repeatable manner to evaluate each brokerage.

  • Online inquiries: we inquired about specific, median-priced properties on individual brokerage websites (not Zillow), primarily through online forms or similar calls to action.
     

  • Open houses: our secret shoppers walked into local, median-priced open houses across the nation and collected specific data points about their experience.


Table stakes for an online lead is simply receiving a response – and nearly half of all inquiries went unanswered. 

  • On average, it took 8 hours and 17 minutes to respond to an online inquiry, although the median time was a more reasonable 39 minutes.
     

  • All of our inquiries were made during normal business hours on weekdays.


Open homes didn’t fare much better: 42 percent of the time the hosting agent never asked a shopper for their contact information.

  • Of the 58 percent of agents that did ask for contact information, a third of the time the agent never followed up with a phone call, email, or text message.
     

  • The net result is that 62 percent of in-person, open home shoppers – which some may argue are fairly high intent customers – had no follow-up after touring a home.


We secret shopped over 25 brokerages across the country, shopping each between two and three times.

  • By far the most significant observation, for each brokerage and across brokerages, was that most interactions were consistently inconsistent.
     

  • There was no rhyme or reason to the level and quality of follow-up – or even if there was any follow-up at all; it was a roll of the dice each time.
     

  • More details, comprehensive data, and examples will be included in an upcoming report.


The bottom line: This is a perfect illustration of real estate’s Last Mile Problem – and lays bare the immense opportunity in simply getting the basics right: following up with people in a consistently structured way.

  • In other industries, best practices include secret shopping yourself and your competitors on a regular basis.
     

  • If you want to hire a team to understand what your real customer experience is like, drop us a line.

Debt, Debt, Debt, Debt, Debt


The title of this analysis contains the word “debt” five times – the number of times it appears in eXp Realty’s 2023 annual report – compared to 207 times in Anywhere’s and 254 times in Opendoor’s annual reports.

Why it matters: Word count in annual reports isn’t a scientific measure, but it is an interesting reminder of the critical role that debt plays for some real estate tech companies.

  • Mentions of debt, and amounts of debt (not the focus of this analysis), vary greatly between companies.


Some companies, like Anywhere, have large amounts of long-term debt that needs to be paid back over time (plus interest).

  • From Anywhere’s annual report: “Our liquidity has been, and is expected to continue to be, negatively impacted by the substantial interest expense on our debt obligations.”
     

  • Anywhere goes on to summarize the risks of high debt: “...a substantial portion of our cash flows from operations must be dedicated to the payment of interest on our indebtedness and…is therefore not available for other purposes, including our operations, capital expenditures, technology…”

Companies like Opendoor, on the other hand, utilize short-term debt as a core component of its business operations (purchasing houses).

  • From its annual report: “We utilize a significant amount of debt and financing arrangements in the operation of our business.”
     

  • For Opendoor, the risks are less about repayment of debt, and more about exposure to changing interest rates: “Our leverage could have meaningful consequences to us, including increasing our vulnerability to economic downturns, limiting our ability to withstand competitive pressures, or reducing our flexibility to respond to changing business and economic conditions.”

The number of mentions over time presents a rough corollary to the role that debt plays in the operation of a business. 

  • Debt has been a critical component for Opendoor and Anywhere for years – and as a brokerage, Anywhere has a more intimate relationship to debt than its peers like RE/MAX, Compass, and eXp Realty.
     

  • Zillow’s debt mentions fluctuated as the company got into, and then out of, iBuying.


The bottom line: Some companies have debt, some don’t, and some have a LOT of debt, which comes with its own set of consequences.

  • There’s nothing inherently wrong with debt, but it does come with risks and needs to be well managed.
     

  • And for those companies saddled with debt, it can limit their ability to invest for future growth (read more: Cash Flow is King).

Cash Flow is King


Profitability can be reported in a variety of ways: Net Profit, EBITDA, Adjusted EBITDA, Adjusted Net Profit, Gross Profit, and cash in the bank are just a few possible metrics.

Why it matters: While each is important, none really measures the actual profitability of the core operating business model.

  • Because before debt repayments, stock buybacks, and acquisitions, what really matters is how much cash the business generates, and that metric, buried in the Cash Flow Statement, is net cash provided by operating activities.


Using net cash provided by operating activities as the baseline, it’s possible to compare the business models and relative profitability of the top publicly-listed real estate companies.

  • The measure here is business model efficacy – cut through the hype, misleading metrics, and adjacent financial maneuvering to look at the core business: does it make money?

In 2023, Zillow and eXp Realty, followed closely by Anywhere, were all cash-generation machines. 

  • Zillow often gets lambasted as being “unprofitable” (on a net profit basis) and eXp’s business model has been questioned for years, but both generate a lot of cash.
     

  • Opendoor’s financials are unintentionally obfuscated behind the massive cash inflows and outflows of buying and selling real estate – this analysis excludes those cash flows for all iBuying activities.


Historically, these companies are generally either consistently profitable or unprofitable.

  • Zillow, HomeServices of America, eXp, and, for the most part, Anywhere, have all been profitable since 2018, with 2021 a notable highpoint.
     

  • Opendoor, Compass, and Redfin have all been generally unprofitable during the same period (Redfin was briefly profitable in 2020 and 2021).


Over the past six years, the most profitable companies have deployed their free cash in very different ways.

  • Zillow and Anywhere, two very different companies whose only similarity is that they’re both in real estate, have each generated about $2 billion in cash since 2018.
     

  • Zillow used that cash to grow, investing over $1B in acquisitions, while Anywhere used it to pay off about $1B in debt (only $2.3B to go!).


The same trends continue into 2024 with Zillow and eXp continuing to generate large amounts of cash, with a few other noteworthy outliers. 

  • Compared to the same time last year, the biggest improvement in cash flows has been at the most unprofitable companies (Opendoor, Compass, and Redfin), which have been energetically cutting costs and reducing expenses.
     

  • The large Q1 cash burn at Anywhere is seasonal, and highlights the fluctuations of a traditional brokerage business (eXp, however, still generated cash).


The bottom line: It may sound elementary, but a real business needs to have a business model that works – and that’s consistently making more money than it spends.

  • It is those businesses – generating free cash flow – that are able to invest for growth, give returns to shareholders, and use the profits to launch new ventures to add value in the real estate ecosystem.
     

  • Even with plenty of cash in the bank, companies whose core business is unprofitable are much more constrained in their operations and can’t survive forever; either the business model pivots or the company will cease to exist.

Investing for Growth: Zillow and Redfin in Mortgage


A number of real estate tech companies have ambitions to grow mortgage businesses, and results from the past year highlight which companies are actually gaining market share.

Why it matters: The data shows, in very real terms, what “investing for growth” really means, and which companies are best positioned to grow mortgage as a meaningful adjacency.

  • Zillow is the standout, doubling its MLO (Mortgage Loan Originator) headcount over the past 14 months – during a very difficult time to be in mortgage.


In a down market, it’s rare for a company to double its mortgage headcount.

  • But one other company has done so, seemingly back from the abyss: Better Mortgage.
     

  • After shedding over 1,000 MLOs during the dark days of 2022, Better is back – or at least investing for growth – by doubling its MLO headcount over the past year.


Redfin has slowly shed MLOs since its acquisition of Bay Equity Home Loans in 2022.

  • Like Zillow, its goal is to attach mortgage services to its core brokerage operation, but in contrast to Zillow, its headcount is shrinking (down 30 percent since acquisition).


More MLOs correlates to more funded loans: Comparing the two portals over the past year, Zillow has more than doubled its loan origination volume, while Redfin’s has slightly declined.

  • Redfin’s mortgage business is still larger than Zillow’s, but unlike Zillow, it’s not growing.


The bottom line: My latest podcast guest, Greg Schwartz, CEO of Tomo and former president at Zillow, summed up the situation well: “Growth is in our control.”

Skyrocketing Delistings and the Pricing Imbalance


The amount of homes listed for sale and then delisted – taken off the market without selling – is rocketing to all-time highs.

Why it matters: Rising delistings are a sign of a pricing imbalance, with asking prices higher than what buyers are willing to pay.

  • National delistings, as a percentage of total listings, are roughly double the normal rate, bucking seasonal trends, and accelerating rapidly.


It all starts with pricing – and new listings coming to market are being priced very high.

  • The median price per square foot on new listings is at record highs.


Another sign of a pricing imbalance are price drops, the number of which are also rising.

  • The percentage of active listings with price reductions is higher than it’s been for years, and is increasing.


And for the houses that are selling, it’s taking longer.

  • The median amount of days on market is slowly increasing and is higher than past years.


The bottom line: The surge of new listings coming to market are overpriced, leading to a rapidly increasing number of delistings and price drops.

  • This is the start of a price correction; sellers are bringing more inventory to market, but with “aspirational pricing” that buyers are not willing to pay.
     

  • The record number of pricing corrective measures will likely lead to an overall correction – lower prices – as supply and demand continues to rebalance.

Mixed Messages in the Market


Compared to last year, new listings are up and existing home sales are down – a tale of two metrics – but with a promising silver lining.

Why it matters: New listing volumes are a leading indicator for existing home sales, which typically lag by two to three months, meaning the current surge in new listings is a hopeful sign for the remainder of the year.

Data points: Compass has 35 percent more listings than the same time last year – a trend which has been steadily increasing since January – with about the same number of agents.


Nationally, new listings are up about 15 percent compared to last year, according to Redfin data (which measures all listings in a market, not just Redfin’s listings).

  • New listings aren’t quite at the levels of 2021 and 2022, but are well off the lows of 2023, meaning inventory is building.


But new listings are not yet translating into sales, which is reported monthly by the National Association of Realtors.

  • After a relatively steady start to the year, existing home sales in March were down 10 percent compared to 2023, and down 19 percent compared to the historical average.


For the first quarter of 2024, existing home sales were down 17 percent compared to the pre-pandemic historical average (2012–2019).

  • At this rate, total transactions for 2024 would end up at 4.3 million, up 6 percent from last year.


What to watch: I think it has something to do with interest rates.

  • But also keep an eye on days on market to make sure inventory isn’t just sitting on the market (sellers without buyers).

The bottom line: It’s a confusing time with mixed messages coming from the market, making it easy to spin whatever narrative you want (armageddon vs. a healthy recovery).

  • There’s no simple answer to what’s going on, just data: new listings are up significantly and sales are lagging.
     

  • 2024 will likely be another depressed year of activity, but the best leading indicator of future activity, new listings, is looking promising.

The Highest Paid Execs in Real Estate


Between 2021 and 2023, the CEOs of real estate’s largest public companies had highly varied upside from the sale of company stock – ranging from $145 million to $0 – while their companies had massive financial gains and losses.

Why it matters: Executive compensation through stock sales is a worthwhile datapoint to consider when thinking about a CEO’s optimism about the future of their business – and how they are incentivized to lead that business.

  • And in reality, that compensation appears to be very loosely based on a company’s actual financial performance, if at all.

Dig deeper: Between 2021 and 2023 Opendoor experienced significant financial losses, with a combined net loss of $2.3 billion and an Adjusted EBITDA loss of $737 million — typically the most favorable financial metric (closely approximating cash flow).

  • During that time, Opendoor’s CEO sold $145 million in company stock through dozens of transactions – $112M during the first two years (as CEO) and $32M in 2023 (as president of marketplace) before leaving the company in January 2024.
     

  • Between the first sale in 2021 and the last sale in 2023, Opendoor’s stock declined 83 percent.


During the same three years, Zillow had a combined net loss of $787 million but a positive Adjusted EBITDA of $1.1 billion — significant cash flow.

  • The CEO of Zillow sold $86 million of company stock in March 2021, when Zillow’s stock price was near an all-time high.
     

  • Zillow’s stock has dropped about 58 percent since then, but there have been no subsequent stock sales.


The other publicly listed companies round out the list, revealing several interesting outliers – including CEOs that have sold no stock.

  • The CEO of Redfin, which was unprofitable, sold $19 million in company stock — and also purchased $300k of stock in late 2023, while the CEO of eXp Realty, which was profitable, sold $71 million in company stock.
     

  • Interestingly, the CEOs of Compass (unprofitable) and Anywhere (profitable) have not sold any company stock during this same period of time.


It’s hard to ignore the outliers.

  • The former CEO of Opendoor, the most unprofitable company in the peer group, made the most from stock sales.
     

  • While the CEO of Compass, which went public about the same time as Opendoor, and the CEO of Anywhere, which was the most profitable, sold no stock.

The bottom line: There’s a before and after not included in this analysis: under what conditions a CEO was granted stock, why they decided to sell, and what they did with the money. 

  • The focus here is the specific financial upside realized by the CEO – compensation for doing a job – how it compares to a peer set of CEOs, and how it relates to actual company performance.
     

  • The results are inconsistent and reveal a massive variance – more than I expected – and in that white space is an opportunity to learn more about incentives and intentions.

The DelPrete Probability Paradox


There is an inverse correlation between how likely something is to occur and how much attention it gets – a phenomenon a friend has dubbed the DelPrete Probability Paradox.

Why it matters: This leads to attention being focused on the highly exciting, yet least likely scenarios, which dilutes focus and clarity while creating noise and distraction. 

  • Getting informed and being entertained are two separate things; boring headlines don’t sell papers.


Real estate is rife with possibility – news headlines and conference agendas are packed with topics that exist in the realm of the possible and plausible, but not necessarily probable.

  • Will AI replace agents? What will happen to interest rates? How will the commission lawsuits change the industry?
     

  • The reality is that no one knows, and the most probable outcomes are slow, incremental deviations from the current state, not radical changes.


Probability revolves around the existence of data, facts, and evidence – the more we know, the more certain the predictions.

  • The least likely events – the possible – generally exist in a reality light on facts and flush with speculation. 
     

  • Facts are important; they form a trajectory of likeliness – plotting them over time and triangulating data points can identify likely outcomes.


For example: Opendoor’s IPO prospectus presented a very plausible argument supporting its ability to attach adjacent services to a real estate transaction.

  • The company asserted that because it had success attaching title & escrow services to its sales, it would be able to attach other adjacent services like home loans.
     

  • The story made sense – to those outside of the industry – but in the end it didn’t work and Opendoor shut down Home Loans. Plausible, yes, but not probable.


Inertia rules: Newton’s First Law states that an object in motion will stay in motion unless acted upon by an outside force – in other words, systems tend to remain constant.

  • Consider the percentage of homeowners that use a real estate agent to sell their home: even after the introduction of Zillow, Opendoor, and billions of dollars in venture capital pushing alternative models, it remains at a 40 year high.


Speculation is running high with the recent NAR settlement; my thoughts were summed up in this Bloomberg article.

  • "Right now, everyone is turning this ruling into what they want it to be,” said Mike DelPrete, who teaches courses on real estate technology at the University of Colorado Boulder. 
     

  • “Some people are saying not much is going to change. Others want the story to be that it’s a seismic shift for the industry.  The whole thing is being driven by fear and uncertainty.”

The bottom line: Don’t confuse news with entertainment – news is meant to inform, entertainment is meant to distract. 

  • Making smart decisions requires cutting through the noise and gathering evidence, pattern matching, and distilling insights.
     

  • But it's easy to get distracted, which is the crux of the DelPrete Probability Paradox: the less likely something is to occur, the more attention it gets.

Profitability as Proxy for a Healthy Business Model


In 2023, the largest, publicly-listed real estate companies had another unprofitable year with over $1.1 billion in losses.

Why it matters: Profitability is an important metric – it’s a proxy for a healthy business model that has product market fit, is financially viable, and can generate returns for shareholders.

Dig deeper: Net Income (or Loss) is the standard, GAAP-friendly, apples-to-apples method to report a company’s overall financial profitability (or lack thereof).

  • Of all the public companies in the real estate ecosystem, eXp Realty was closest to profitability in 2023, while Compass and Opendoor had the largest losses.


Net Margin is a company’s net loss proportional to its revenue – losing $100 million is different for a company with $1 billion in revenue compared to a company with $100 million in revenue.

  • Net margin is an illuminating measure of a company’s business model; how effective is it at generating profits for shareholders? Is the company a cash generator or a cash incinerator?
     

  • eXp once again comes out on top, but the outlier is Redfin, which, proportional to revenue, was significantly less profitable and less capital efficient than its peers.


The Net Income of the “biggest losers” is being dragged down by large stock-based compensation expenses (compensating staff with stock options and grants).

  • In 2023, Zillow had $451 million in stock-based compensation expense, Compass $158 million, and Opendoor $126 million. 
     

  • These equity awards are a non-cash expense, but they do have a cost: diluting shareholders.


With exponentially higher stock-based compensation expense than any other company, Zillow is the noteworthy outlier in the chart above.

  • Without it, the company would be materially profitable (along with eXp Realty and Real).

Net loss per transaction is another method to highlight business model efficiency, similar to OpEx per transaction.

  • The low-fee brokerages, with lower operating expenses, and Anywhere with its large franchise network, have the smallest net loss per transaction.
     

  • Note: for Zillow, I’ve assumed 3 percent of 4 million transactions.


Throwing Opendoor into the mix highlights the inherent challenges of iBuying: comparatively, and in the current market, it’s a much less profitable business.


The bottom line: Profitability is not the same as cash flow; unprofitable businesses are not necessarily losing money or at risk of going bankrupt.

  • But it is a valid measure to consider when evaluating the merits of a particular business model – eventually, a business needs to make money.
     

  • For the time being, the most profitable – or least unprofitable – companies are traditional brokerages, especially cloud-based ones, while the disruptors and tech companies continue to struggle with sustained profitability.

Agent Migration and the Power of New


I recently wrote about Learning From A New Generation of Brokerages, which includes the migration patterns of tens of thousands of agents across the industry. 

Why it matters: Agents change brokerages for a variety of reasons – technology, compensation, support, brand – but it turns out one of the biggest factors may simply be that agents are attracted to new things.

  • During 2023, agents continued to stream out of the big legacy brands for the lure of low-fee brokerage models, where agents can keep more of their commission.


Dig deeper: Aside from compensation structures, another factor appears to be at play: the average age of the brokerage.

  • Real, Fathom, United, RealtyOne, Compass, and eXp Realty, with an average brokerage age of 14 years, are all attracting agents.
     

  • While HomeServices of America, Keller Williams, RE/MAX, and Anywhere – the legacy brands with an average age of 43 years – are all losing agents.


Which raises an interesting question: why?

  • Real estate agents are entrepreneurs, and like the hard-working hustlers they are, appear to always be looking for something new: new ideas, new models, and new opportunities to grow their businesses.
     

  • New brokerages are brimming with actual and perceived potential – the potential to be more and do more for agents.

The bottom line: The industry is shifting, and one powerful trend is the migration of agents between brokerages. 

  • A number of factors are driving that movement, but a major determinant appears to be the relative age of the brokerage.
     

  • Which is a timely reminder of the entrepreneurial spirit of agents and the alluring power, and potential, of something new.

Learning From A New Generation of Brokerages


Behind the hype of year-end press releases and the incomprehensible density of financial metrics, clarity is emerging on the shifting brokerage landscape.

Why it matters: The industry is changing – a new generation of brokerage businesses is rising, attracting more agents and operating more efficiently than their legacy peers.

Context: Overall transactions were down 19 percent in 2023 compared to the previous year – a significant market slowdown.

  • eXp Realty, Compass, and Keller Williams outperformed the market, with smaller transaction declines, while the big legacy firms HomeServices of America (HSoA) and Anywhere were on par with the overall market.
     

  • The notable outliers are Redfin, which underperformed the market by a wider margin, and the Real Brokerage, which grew its transaction volumes a whopping 78 percent.


Transaction volumes over the past seven years paint a fascinating picture of disruption.

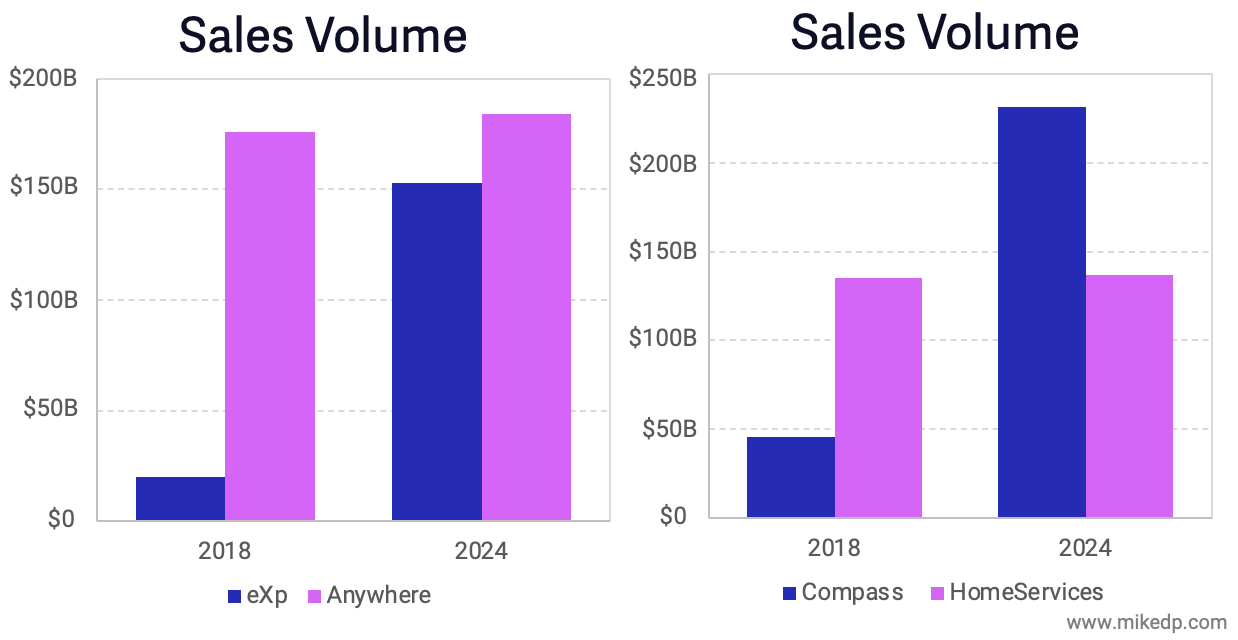
  • During that time we’ve seen the exponential growth of eXp Realty and Compass, moving from effectively zero to top spots in transaction and sales volume.
     

  • At the same time, the two incumbent leaders (Anywhere and HSoA) went from total dominance to being usurped by these two disruptive start-ups.


Agent migratory patterns continued at pace with agents streaming out of the big legacy brands for lower-fee models (and Compass).

  • In the current downturn, the lure of the low-fee brokerage is simple: agents can keep more of their commission.
     

  • Which comes at the expense of the large, legacy brands including RE/MAX, HomeServices of America, Anywhere, and Keller Williams, who collectively lost over 19,000 agents in 2023.


Here’s another way to look at the same data that helps show perspective relative to each firm's size.


Zooming in to agent movement between Keller Williams, RE/MAX and eXp Realty highlights this continuing flow of agents.

  • According to 3rd party data from hundreds (but not all) MLSs, 1,627 agents moved from eXp to KW during 2023, while 3,099 agents moved in the opposite direction -- for a net gain of 1,472 agents in eXp's favor. 
     

  • Similarly, 388 agents moved from eXp to RE/MAX during the year, while 897 moved in the opposite direction – for a net gain of 509 agents in eXp’s favor.


Alongside the shifts in transaction and agent count, there is an underlying shift in brokerage business model efficiency.

  • Keeping in mind that eXp is the largest brokerage based on transaction volume, its operating expenses (OpEx) per transaction is one-fifth its brokerage peers.
     

  • Even Redfin, which has exemplified an efficient, tech-driven brokerage model, has a cost structure closer to an incumbent than a disruptor.


What to watch: The results bring to mind an out-of-context but still relevant Gary Keller quote: “We’re losing so slowly we think we’re winning.”

  • But it’s not as simple as winners and losers, and each number tells a part of, but not the entire, story.
     

  • For example, although Keller Williams lost the most agents in 2023, it still outperformed the market -- so context is key.

The bottom line: In a recent Inman presentation, I unpacked what a Netflix vs. Blockbuster moment in real estate would look like, and how a receding tide reveals business model resiliency and clues about future growth.

  • The key message here is less about winners and losers, and more about learning.
     

  • It’s a transformative time in the industry, and now is an opportunity to pause, step back, critically evaluate, and use the moment to get smarter – what can you learn?

Positive Signals for Compass & The Market


Compass’s for sale listings are up 15 percent compared to the same time last year – just one example of rising activity across the U.S. real estate market.

Why it matters: An increase in for sale listings is a welcome sign of more sellers coming to market, good news for businesses in the real estate ecosystem, and a promising start to the year after a depressed 2023.

  • Compass, the nation’s largest brokerage based on sales volume, currently has 2,000 more listings than the same time last year – and that number is increasing.


On a year-over-year basis, the number of Compass listings has gone from down 8 percent in July to up over 15 percent at the end of January – a significant change in fortunes.

  • Aside from being good for buyers, this is good news for Compass – more listings should lead to more sales and more commission revenue.


New listing volumes and revenue are indirectly correlated (because of the time lag between a listing and a sale). 

  • In Q3 2023, Compass’s listing volumes were down 5 percent and revenue was down 10 percent year-over-year (YoY).
     

  • But things are looking up: Compass listing volumes were up 3 percent in Q4 and are currently up 13 percent in Q1 – positive signs that won’t appear in Q4’s financials but will land in Q1 2024.


And Compass is not alone; according to Redfin’s national data, new listings are up significantly across a number of major U.S. markets.


The increase in activity appears to be driven by – wait for it – interest rates.

  • With the recent drop in rates, mortgage demand has spiked to the highest level in six months.


The bottom line: From a transaction volume standpoint, 2024 is off to a promising start.

  • From a business perspective, more transactions means more commission income – the $90+ billion that fuels so much of the industry, from agents to brokerages, from portals to tech vendors. 
     

  • It’s still very early, but these are signs that would signal a positive shift in the market and, therefore, good news for the ecosystem of businesses that surround the transaction.

The Great Disruptor Hibernation Continues


When the market turned in mid-2022, many real estate disruptors began the long and painful process of reducing expenses, laying off staff, and reorienting their businesses to a new, challenging reality.

Why it matters: A year and a half later most disruptors are still around, but remain a shadow of their former selves and have yet to show signs of emerging from hibernation.

Dig deeper: The pre-2022 low interest rate environment was a breeding ground for real estate tech disruptors that relied on a financial component as the core of their product offering and business model – using cheap money to solve consumer pain points (iBuying, Power Buying).

  • Because of this, many disruptors operate in the mortgage space and hired mortgage loan originators (MLOs) to service their customers.
     

  • And as these companies rightsized to a high interest rate environment, they slashed their MLOs anywhere from 50 to 85 percent (and in Opendoor’s case, down to zero).


Zillow has been the outlier, accelerating the hiring of MLOs for Zillow Home Loans since February ‘23, at the same time its smaller peers have been shedding the same.

  • This is both a clear signal of intent around Zillow’s plans to build Zillow Home Loans, and a powerful demonstration of the benefits of having a strong balance sheet.
     

  • Read more: Zillow Still Crazy About Mortgages.


Arch-disruptor Opendoor, meanwhile, has embraced reality by significantly reducing the amount of homes it’s acquiring – all in an effort to streamline the business.

  • Opendoor’s purchases have stabilized at around 1k per month – orders of magnitude lower than the highs of ‘21 and ‘22 – but with a recent uptick as the company aims to double its monthly acquisitions. 
     

  • The goal appears to be refocusing the business on the core iBuyer proposition after years of adjacent distractions (like Opendoor Home Loans).


The bottom line: For many disruptors – private companies that don’t publish much data – MLO count remains the best leading indicator of demand for their services.

  • For the time being the disruptors are still in hibernation mode, but if and when the tide begins to turn, MLO count should begin to tick upwards.
     

  • And by that time, the surviving disruptors will be battle-hardened with more nimble and streamlined operations, better product-market fit, and on stronger financial footing with more rational business models.