My "iBuying Disrupted" Presentation

DelPrete-1-1984x880-1.jpg

"Only Mike would start a 9 a.m. presentation talking about EBITDA and GAAP financials." – Anonymous Zillow executive

Two weeks ago I had the pleasure of speaking at Inman Connect Las Vegas -- one of the world's premier real estate conferences. My talk, "iBuying Disrupted: Battle of the Behemoths," was followed on stage by Rich Barton, CEO of Zillow, Glenn Kelman, CEO of Redfin, and Eric Wu, CEO of Opendoor. What a lineup!

Watch the video


At the Inman Connect Las Vegas 2019 conference, Mike DelPrete, an entrepreneur, analyst and real estate industry strategic adviser, took to the stage to explain the seismic shifts shaking up the residential real estate market.


Some of my favorite lines from the presentation:

“There’s a new competitive advantage in town: sustained unprofitability.”

"Red is the new black."

"Agents are the ultimate iBuyer aggregator."

“iBuying is the new Zestimate."

“Companies and agents that win will be the those that empower consumers to make the choice that’s right for them.”

In addition to the video of my presentation, you can also download a copy of my my presentation slides. I'd love to hear your feedback!

Inside Compass — Part 5: Endgame

A big hairy audacious goal (BHAG) is a phrase, coined by author Jim Collins in his book Built to Last, meant to convey a company’s visionary “moonshot” goal, often bordering on the unachievable. Think of SpaceX’s aim to make humanity multiplanetary or Google’s goal of organizing the world’s information. These are BIG goals and exponential ideas, without a hint of incrementalism. And big ideas have a tendency to attract big investment.

In real estate, optimizing the commission split and generating revenue by selling mortgages are what brokerages have been doing for years. Going down that path is an old, incremental game plan, which is why it’s unlikely to be Compass’ destination. Investors didn’t pump over $1 billion of venture capital into Compass to build “just another brokerage.”

Compass clearly has big ideas and big goals. But what exactly is its big hairy audacious goal?

More than a brokerage

To justify its massive valuation and satisfy its investors, Compass must become more than a brokerage. Having raised over $1.1 billion at a hefty $4.4 billion valuation, Compass is already richly valued as a tech company rather than a traditional real estate brokerage.

 
Screen+Shot+2019-05-13+at+12.42.04+PM.png
 

When a company raises venture capital, especially at the scale Compass has, investors expect a significant return on their investment. When SoftBank invested in Uber in 2018, it was valued at $48 billion with expectations of a $100 billion IPO (as of June 2019, Uber is worth around $75 billion).

As a late-stage, private company almost certainly heading towards an IPO, investors likely have similar expectations for Compass — call it a $10 billion valuation at IPO. Compass can’t justify this valuation as a traditional real estate brokerage. Incremental improvements are not in the cards; to achieve a meaningful outcome for owners and investors, Compass needs to embrace more radical changes to its business model, and real estate in general.

Changing the game

As we’ve seen in my previous analysis, Compass’ economics are similar to a typical brokerage. The primary revenue and expense drivers are the same: revenue generated as a percentage of the commission from real estate agents, and expenses driven by employee costs, office space, administration and technology.

To date, the models that have meaningfully shifted core brokerage economics at scale have all featured novel operating models. Redfin, with full-time, salaried agents, and Purplebricks, with a fixed-fee independent contractor network — both backed by significant lead capture and centralized support organizations — have demonstrated exponential efficiency gains.


From an economic standpoint, the efficiency gains pay off for the brokerage. Redfin operates at a gross margin of 24 percent (about double Compass), while Purplebricks U.K. enjoys gross margins over 50 percent.

 
compass: estimate, Industry average: real trends industry benchmark, redfin: fy2018, purplebricks: fy19 (U.k. only)

compass: estimate, Industry average: real trends industry benchmark, redfin: fy2018, purplebricks: fy19 (U.k. only)


Because of their novel operating models, Redfin and Purplebricks have a great deal of direct control over their agents, allowing them to standardize processes to deliver a more uniform and efficient consumer experience.

For Compass to break out of the traditional brokerage mold and fully realize its ambitions, it needs to become more than a brokerage, and more than a technology company. It needs to become a platform. And in doing so, radically change brokerage economics and, consequentially, the role of agents.

The platform play

To become a true real estate platform, Compass first needs to become a consumer destination.

Redfin has its portal, Uber has its app, and Purplebricks (in the U.K.) has its web site. In each case, consumers go directly to the company — not an agent or driver — to start their journey, giving the platform owner unprecedented ecosystem power. The platform owner controls the lead, distributes it, and takes a healthy cut of the revenue. If an employee or contractor doesn’t perform to expectations, the company removes them. The platform owner is in complete control.

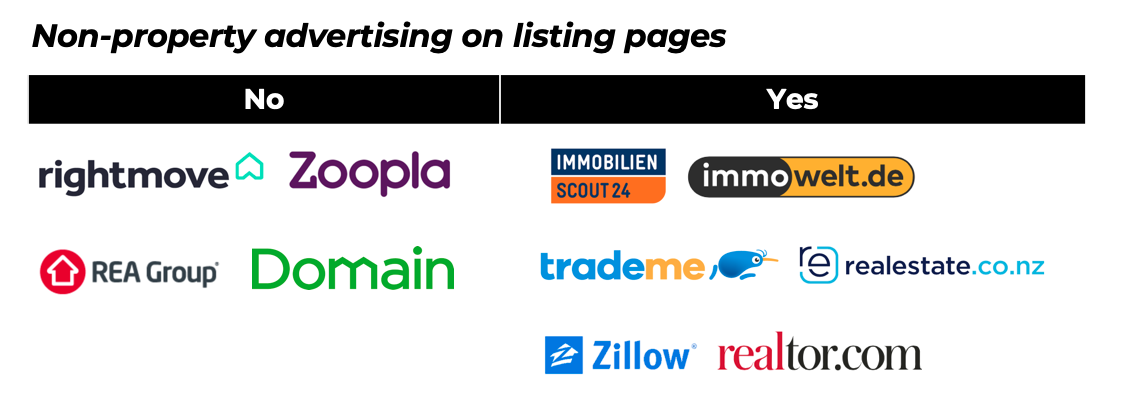
For Compass to become a consumer destination, it needs eyeballs. The most effective strategy — and likely the only possible strategy given the market dominance of Zillow — is to build consumer traffic with the draw of exclusive listings. It’s a similar strategy to Netflix and Amazon’s exclusive video content. If the Compass web portal advertises houses for sale that aren’t available anywhere else, it draws consumers to the platform.

Building exclusive content

The secret to building audience with exclusive content is scale: Compass needs significant market share for this strategy to work. Pocket listings, which are withheld from the MLS for a period of time, have been around for years, but never employed at this scale. Compass needs to advertise so much exclusive content, including coming soon listings, that consumers can’t afford to miss it.

The evidence that Compass is strongly promoting exclusive content is plainly visible on its web site. In fact, exclusive content is the primary call-to-action on Compass’ web site, starting with top billing on its site navigation.

Scrolling down the page, the first content after the search box is a section highlighting exclusive listings before they hit the market.


A few Google searches for homes for sale in San Francisco yields the following results. Not only is Compass paying top dollar for its position, but notice who it is competing and bidding against.

Compass is expending a considerable amount of resources to attract consumer eyeballs to its web site. In addition to the above, it has search engine optimized pages for exclusive properties in each market. This focus on exclusive listings currently sets Compass apart from Zillow, Redfin, Purplebricks, and most other traditional brokerages — no other company gives it this much focus (or any focus at all).

The result is a high proportion of listings that are exclusive to Compass (which includes coming soon). As of June 2019, anywhere from 12 to 27 percent of Compass listings in a market are exclusively listed on the Compass web site — a significantly high number. Across six markets, that represents over 1,800 listings, none of which are advertised on the MLS or any other portals, including Zillow.

 
Screen Shot 2019-06-26 at 4.38.22 PM.png
 

Compass is encouraging agents and consumers to list properties as Coming Soon as an effective pre-sales tool. This agent team page touts specific benefits, such as fewer days on market and more visitors at the first open home, while this agent team highlights the benefits of increased exposure and pre-listing feedback.

Flexing its platform power

Once Compass has consumer eyeballs, what’s next? The same thing that Zillow, Redfin, and Purplebricks do: generate and control the distribution of leads to agents.

Recently we have seen more power being accrued in real estate platforms that distribute leads. Realtor.com’s $210 million acquisition of Opcity and Zillow’s new flex pricing product both charge real estate agents around a 30 percent referral fee when a transaction closes. Over time, the amount charged for a lead has consistently gone up.

Redfin and Purplebricks also control the flow of leads. Redfin distributes its leads to salaried agents, while Purplebricks pays its local property experts in the U.K. around 25 percent of a fixed listing fee. Both companies control the flow and distribution of leads to their agents, which is a necessary ingredient for a platform to fundamentally change the economics of a traditional real estate brokerage.

Endgame

It would be naive to think Compass has raised over $1.1 billion in venture capital to become just another real estate brokerage. Even adding adjacent services like mortgage doesn’t change the core economics of the broker model — bigger changes are required to justify its valuation. Compass has larger ambitions, and it’s likely that its big hairy audacious goal is to become a real estate platform. The evidence suggests the following strategy:

  • Build market share (listings) through aggressive agent recruitment and acquisition.

  • Once market share is high enough, encourage sellers to list exclusively on Compass for a period of time.

  • Leverage exclusive content to drive consumers to the Compass portal.

  • Launch a Compass platform that generates and distributes leads to agents.

  • With platform power, transition the role of an agent (Redfin/Purplebricks/Uber), taking a larger cut.

Compass is a real estate disruptor on a scale never before seen in the U.S. With deep pockets and big ambitions, its impact on the real estate industry is only just being felt. Compass, its investors, and a number of well-funded peers are aiming for massive change in an industry that has resisted massive change for years. Whether its strategy succeeds or fails, the die is cast and the race is on.


Inside Compass: A Strategic Analysis

My epic, five-part Compass analysis in one easy to read whitepaper. Download the free PDF and enjoy!

4 strategies for agents to stay relevant in the age of iBuyers

New content alert! I'm trying something new: crisp, strategic "quick hits" that offer actionable suggestions. I usually publish evidence-based industry insights, while my consulting work focuses on hands-on strategy and guidance. This is meant to bridge the gap between the two -- let me know what you think!

iBuyers are a rising force in real estate. Companies like Opendoor, Offerpad, and Zillow are collectively spending billions to offer consumers a new way to buy and sell homes. As iBuyers expand nationally, more and more real estate agents and brokers are being faced with a key strategic question: How do we stay relevant in the age of iBuyers?

As overall iBuyer activity exceeds 1,000 home purchases and sales per month in just one market -- Phoenix -- it’s a trend that can't be ignored.


I’ve conducted deep analysis on iBuyers for the past four years, culminating in the recently released iBuyer Report. Based on that background and my work in the industry, I offer four key strategies agents and brokers should consider when evaluating their response to iBuyers:

Be a trusted advisor. The role of a real estate agent has always been to help guide consumers through the home buying and selling process. An instant, cash offer on a house simply represents a new path to the same end. This doesn’t mean there isn’t a role for an agent; it’s simply another path that needs navigating. And the agent is uniquely placed to be that expert advisor.

Solicit multiple offers. As a trusted advisor who represents the home owner’s best interests, an agent is well-suited to solicit multiple offers on a home from multiple iBuyers, and to present those offers alongside a traditional market sale. The iBuyers’ online processes make it easy to receive multiple offers; the agent can do the work and provide guidance. Each major iBuyer offers partnership programs that pay a referral fee for a successful transaction.

Don’t ignore them. iBuyers are spending millions of dollars each month on direct-to-consumer advertising (TV, radio, and digital). Agents and brokers can’t (and shouldn’t) compete with that spend, and they can’t ignore the fact that consumers are being educated -- on a massive scale -- about iBuyers. Ignoring them won’t make them go away. (In the past two months alone, I’ve been quoted in the New York Times, the Wall Street Journal, and Marketplace -- all doing stories about iBuyers.)

Highlight the power of personal relationships. Real estate agents are people, and iBuyers are corporations. If you’re an agent, highlight the personal relationship you bring to the process. The power of human psychology is incredibly strong in real estate; brokers and agents should use it to their advantage.

iBuyers represent a significant shift in the real estate landscape, but it’s not a zero-sum game. Real estate agents and brokerages can employ specific strategies to stay relevant, highlight their strengths, and maintain their position as a trusted advisor in the center of the transaction.

Inside Compass — Part 4: Sustainability

Part One of this series took a detailed look at Compass’ growth strategies, while Part Two examined if Compass is a tech company, or a traditional brokerage, and Part Three looked at Compass’ $4.4 billion valuation compared to its industry peers.

Part Four of this series looks at sustainability. Can Compass keep up its aggressive — and expensive — acquisition strategy? Will agents, without whom Compass wouldn’t generate any revenue, remain happy and stay under the Compass banner? And perhaps most importantly, can the company generate a profit?

The search for profitability

Compass is not profitable. Given its massive expenditures — both to support its brokerage acquisitions and to support its growing employee base — there’s simply no way it can be making money. Nor should it be (yet).

Compass is a growth stage business, investing today for a more powerful and profitable tomorrow. The question for all growth-stage businesses is whether they can ever achieve profitability. A number of other real estate industry behemoths are also unprofitable on a GAAP basis: Zillow, Redfin, Opendoor, eXp Realty, and Purplebricks.

Compass, like all private companies, does not need to share its financials. But with the data is does make public, in addition to benchmarks against public company peers and a few educated assumptions, we can paint a rough picture of its financials. To refine my thinking for this analysis I’ve spoken to dozens of industry executives and insiders, including leaders of top brokerages, independent analysts, and current and former Compass employees and agents.

Revenue and gross margins

Compass ended 2018 with around $900 million in revenue (source: Robert Reffkin’s letter on Inman). Like its real estate brokerage peers, eXp Realty and Realogy, that number includes the full real estate commission, only a fraction of which Compass retains. A large percentage of that number is paid directly to agents (70%–90%), with a smaller percentage retained by Compass as its gross profit. This is the commission split.

According to REAL Trends, which has been tracking the residential brokerage industry for decades, the average retained revenue (gross profit) of brokerages was 14.9 percent in 2018. The sample size is 200–300 of the largest U.S. brokerages.

 
Screen Shot 2019-06-08 at 7.04.58 AM.png
 

High producing agents typically command more favorable commission splits as high as 90/10 — with only 10 percent retained by the brokerage. There is anecdotal evidence (including a number of agents I’ve spoken to, agents that Compass attempted to recruit, and brokers that have lost agents to Compass) that in some cases Compass offers 100 percent commission splits as a recruiting incentive, either for a certain amount of time or a fixed number of deals.

This is confirmed by the Wall Street Journal, which reports, “The firm has lured top talent with some of the most generous commission splits in the business: Some agents received all the sales commission, with nothing going to Compass, on as many as eight of their first deals, according to offer letters.”

eXp Realty, another self-proclaimed tech-enabled brokerage with revenues of $500 million in 2018, has 8 percent gross margins. eXp Realty also offers favorable commission splits with a cap on fees, and is the best benchmark available for Compass. It’s likely that Compass’ gross margin is in the 10–12 percent range, and for this analysis I’ve assumed 12 percent, resulting in $108 million of gross profit in 2018.

Operating expenses

Estimating Compass’ operating expenses is more complicated. I’ve used three different methodologies in order to provide a range of data points:

  • Operating expenses as a percentage of revenue

  • Operating expenses as a percentage of gross profit

  • Build-up approach

(Readers are encouraged to download the companion Excel file and plug in their own assumptions. It’s a choose your own profitability adventure!)

Compass has four publicly listed peers with similar business models: Realogy, eXp Realty, Redfin, and Purplebricks. Each company reports and breaks out operating expenses into various categories, including technology, marketing, and general and administrative. It’s straightforward to calculate each company’s operating expenses as a percentage of overall revenue, and as a percentage of gross profit.

 
Screen Shot 2019-05-31 at 10.01.09 AM.png
 

On average, the four industry peers’ operating expenses are 32 percent of revenue and 113 percent of gross profit (Redfin and eXp Realty are unprofitable). Applying those same averages to Compass suggests operating expenses of between $122 million and $288 million in 2018.


The build-up approach for operating expenses focuses on known data: employee headcount and office expenses. Based on the same source of information, here’s what is known:

  • Compass had 238 offices at the end of 2018

  • Compass had around 1,500 employees at the end of 2018

Compass operates in expensive metro markets like New York City, San Francisco, and Seattle, so employee costs are on the high end of the spectrum. According to a review of 250 employees on Glassdoor, the average salary for a Compass employee is $72,000 per year (ranging from $60k for an office administrator to $120k for a software engineer).

 
Screen Shot 2019-06-06 at 7.54.05 PM.png
 

That figure doesn’t include benefits; according to the U.S. Department of Labor, on average, employee benefit costs account for around 30 percent of total employee costs. That would put total employee costs at $100,000 per head (salary plus benefits), resulting in an annual staff cost of $150 million for Compass’ 1,500 employees.

For office space, several industry insiders and CEOs of top brokerages claim that 75–100 square feet of office space per agent is a reasonable benchmark. Cushman & Wakefield reports that the national average, across all industries, is 194 square feet per employee. I’ve assumed an average of 83 square feet per agent, or 3,500 square feet for each of Compass’ 238 offices.

Compass pays from the mid-$60s to mid-$70s to $80 per square foot for some of its NYC offices, and $54 per square foot for a San Diego office. I’ve assumed an all-up expense of $60 per square foot, resulting in a total annual rent cost of $50 million.

 
Screen Shot 2019-06-06 at 7.34.55 PM.png
 

Employee and office space expense alone totals $200 million. This figure doesn’t include a number of other one-time and ongoing expenses, such as sales and marketing and office fit-outs, which would push that number even higher.

This figure is Compass’ expense run-rate, based on figures from the end of 2018, a year which Compass grew its employee count and office space incredibly fast. Taking a mid-point average (150 offices and 1,000 employees) yields an employee plus office cost expense of $132 million for 2018.

(Based on this June 12, 2019 update from Compass, there are currently 2,500 employees. Assuming 248 offices, the current employee plus office expense run-rate is $300 million per year (not including other operating expenses), up from the $200 million mentioned above.)

Based on rough industry benchmarks, Compass’ operating expenses could range anywhere between $122 million and $288 million in 2018 (quite a range). But the build-up methodology suggests it was closer to $150—$200 million.


Operating expenses of between $150 million and $200 million in 2018 are nearly double Compass’ gross profit. In other words, Compass would be spending between $1.50 and $2 for every $1 in gross profit — not including its brokerage acquisition costs (which I previously estimated to be between $220 and $240 million, paid in a combination of cash and stock).

 
Screen Shot 2019-06-06 at 7.39.17 PM.png
 

Profitability Catch 22

In its march towards long-term, sustainable profitability, Compass faces a dilemma. Like other brokerages, its gross profit is directly tied to the commission splits it offers agents. Profitability is a Catch 22: reducing commission splits for agents increases gross profit for Compass, but makes the company a less appealing home for agents.

Compass must look elsewhere for new sources of revenue — but it’s unclear where.

Compass’ chief operating officer told the Wall Street Journal, “We’re not yet at a stage where I have a very clear monetization strategy because we haven’t really talked about it.” Its CEO said the company plans to make money through ancillary services like title, mortgage and insurance services, but it’s not clear how. “Short term profitability is something that many of the more modern companies are not as focused on,” he added.

To grow revenues, Compass needs more agents closing more deals, and — unless something radically changes — those agents will require more, not less, support staff and office space. To reduce expenses, Compass would need to trim its full-time headcount or slow the hiring of support staff, or consolidate and close a number of its offices — both of which run the risk of making Compass a less attractive brokerage partner for agents.

The options available to Compass — optimizing the commission split and generating revenue by selling mortgages — are the same available to other real estate brokerages, and in fact, what they have been doing for years. Going down that path is an old game plan, which is why it’s unlikely to be Compass’ destination. Investors didn’t pump over $1 billion of venture capital into Compass to build “just another brokerage.”

Endgame

This analysis presents a thorough look at what Compass is doing; the alluring, unanswered question is why.

The company is deploying an aggressive acquisition strategy to acquire agents and brokers to build market share, is positioning itself as a tech company, and sports a sky-high valuation based on its growth rate and future plans — but what are its future plans? How does it plan to turn the existing, unprofitable brokerage business into a mammoth of the real estate industry? This is the topic of the next and final installment of this analysis: Endgame.

Inside Compass — Part 3: Valuation

Part One of this series took a detailed look at Compass’ growth strategies, while Part Two examined if Compass is a tech company, or a traditional brokerage. Irrespective of the answer, Compass unquestionably needs to be a technology company — both to support its massive valuation, and to be a sustainable business. Is Compass worth $4.4 billion, and is it being valued as a traditional brokerage, or a technology company?

Valuation overview

Compass has raised over $1.1 billion in venture capital, starting with $8 million back in 2012. Its latest $400 million round in September 2018 valued the company at $4.4 billion, up from $2.2 billion in December of 2017. Compass’ rising valuation is matched by its impressively growing revenue.


Compass’ peers in the real estate technology space, both public and private, feature an exciting range of valuations. In general, technology companies like Zillow, Redfin, and Opendoor have higher valuations, while traditional brokerages like Realogy and RE/MAX have lower valuations. Investors clearly favor technology companies.

 
source: public markets, april 2019. Private companies at time of last funding round.

source: public markets, april 2019. Private companies at time of last funding round.


(Both Realogy and Purplebricks have recently released news and earnings results that resulted in a significant drop in valuation. I’ve used numbers from April in an effort to provide a more fair, “moving average” valuation.)

Revenue multiples

One way to determine a company’s value is by using a revenue multiple. That multiple — say 1x or 2x — is multiplied by current revenues to establish a valuation. The higher the multiple, the more optimistic investors are about future growth prospects, and the more that company is worth.

Compass sports a relatively high revenue multiple — rivaled only by tech company Zillow. While its business model is most similar to peers like Redfin, RE/MAX, eXp Realty and Realogy, investors are significantly more optimistic about Compass’ future prospects.

 
based on last full year financials (2018 for most companies).

based on last full year financials (2018 for most companies).


Growth rates significantly factor into a company’s valuation; investors are generally more optimistic the faster a business is growing. This cohort of real estate tech businesses are growing revenues at vastly different rates.

 
Screen Shot 2019-05-13 at 8.53.18 AM.png
 

However, a high revenue growth rate does not necessarily correlate to a high revenue multiple, as evidenced by the following chart. Of the fastest growing companies — Compass, eXp Realty, and Opendoor — Compass boasts the highest revenue multiple, more similar to Zillow and Redfin. (Bubble size denotes overall valuation.)

 
Screen Shot 2019-05-13 at 12.51.25 PM.png
 

Over the past three years, Compass’ valuation has been closely tied to its revenue, which is growing exponentially. As discussed in Part One of this series, that growth has come from an aggressive acquisition strategy. The revenue multiple for each of Compass’ recent capital raises has remained consistent: 5x—6x. Investor sentiment has remained consistently optimistic.

 
Screen Shot 2019-05-13 at 8.58.05 AM.png
 

Transaction volumes

Another metric to consider when valuing companies — especially real estate tech companies that are involved in the transaction — is transaction volume. A number of the biggest companies in real estate, including those discussed here, are newly obsessed with building end-to-end transaction platforms. And an important part of that platform strategy is offering ancillary services such as mortgage and title.

Another angle is the predictive and educational power of data. Whether it’s Zillow, Redfin, Compass, or Keller Williams, all are talking about the power of data in their end-to-end platforms. Many companies consider it a potential competitive advantage, and are making heavy investments to build out enhanced data capabilities.

To fully realize its value, a platform needs to be used. The upsell opportunity around ancillary services and the predictive power of data all require transactions flowing through the platform, and the more the better. Similar to the benefits of network effects, more activity on a platform makes it more valuable. Thus, the more transactions a brokerage facilitates, the stronger position it should have in the overall ecosystem.

A transaction volume metric for company valuations is not typically used nor talked about in the industry. The number of transactions each company conducts, and the number of consumers they touch, again varies wildly.

 
SOURCE: SWANEPOEL MEGA 1000

SOURCE: SWANEPOEL MEGA 1000


Despite so much potential future value being attributed to ecosystems that touch consumers and facilitate transactions, it does not correlate to company value. In fact, it is exactly the opposite. The following chart shows company valuations divided by transaction volumes — or the “value per transaction.”

 
Screen Shot 2019-05-13 at 10.00.13 AM.png
 

Even though Realogy and RE/MAX have, by far, the most transactions flowing through their systems, investors are ascribing very little value to them.

Agent count

Part One of this analysis looked at how much Compass was paying for its brokerage acquisitions. Since the start of 2018, Compass’ agent count has increased from roughly 2,000 to 10,000. Of those 8,000 new agents, around 4,200 came from acquired brokerages. Assuming a total of $230 million spent to acquire fourteen brokerages with 4,200 agents, that’s a cost (or value) of $55,000 per agent.

When Compass raised its latest round in September 2018, it was valued at $4.4 billion, and at the time, had around 10,000 agents. Using the same methodology, each of Compass’ agents was worth — or valued — at $440,000.

 
Screen Shot 2019-05-13 at 2.07.07 PM.png
 

If brokerage valuations were driven entirely by the number of agents — which, incidentally, are the primary revenue drivers — investors are valuing Compass agents eight times higher than what Compass itself is paying other brokerages through acquisition.

What about profit?

There’s one word missing from this analysis so far: profit. What role does the ability of a company to operate profitably play in its valuation? Not much.

Out of the companies mentioned in this analysis — Compass, Zillow, Redfin, RE/MAX, Opendoor, eXp Realty, Purplebricks, and Realogy — collectively worth over $20 billion — only two are profitable: RE/MAX and Realogy. Realogy, the company with the absolute lowest revenue multiple of 0.2x, is profitable. Together, RE/MAX and Realogy are worth $2 billion, less than half that of Compass. Clearly, the potential of future profits trumps the certainty of current profits for investors.

 
profit = net income, not “adjusted ebitda”

profit = net income, not “adjusted ebitda”


Peer valuation scenarios

What would Compass be worth if it were valued like some of its peers (using their revenue multiples)? It’s already at the high end of the range for those with similar business models: RE/MAX, Purplebricks, Realogy, eXp Realty, and Redfin.

 
Screen Shot 2019-05-13 at 1.57.03 PM.png
 

Compass is valued far and ahead of its peers, even those in the same class of technology-enabled brokerage. If it were valued similarly to Redfin, which is a public company, it would be worth $3.5 billion — a $900 million discount to its current valuation. Clearly investors see something more in the company.

If Compass were valued at Realogy’s revenue multiple, it would only be worth $200 million — over 20 times less than its current valuation! Remember: Realogy is profitable, sees over 40 times the transaction volume and has over 6x the revenue of Compass. This stat alone highlights the massive opportunity investors see for Compass, contrasted starkly with the bleak future forecast at Realogy.

A sustainable model?

Investors clearly see something more in Compass — something that massively sets it apart from its peers. Its valuation is being driven by a combination of massive growth fueled by an aggressive acquisition strategy, and the promise of a tech-powered platform to give it a competitive advantage over peers.

It’s fair to say Compass is being valued as a tech company. In fact, Compass is being valued more optimistically than any other traditional or tech-enabled brokerage by a wide margin; it’s valuation more closely matches Zillow, a tech company with a completely different business model.

Having raised over $1.1 billion, Compass is unequivocally causing a revolution in the traditional real estate industry. But how sustainable is its model? Can it keep up its aggressive — and expensive — acquisition strategy, and achieve profitability? And will agents, without whom Compass wouldn’t generate any revenue, remain happy and stay under the Compass banner? These topics are explored in Part Four: Sustainability.

Inside Compass — Part 2: Brokerage or Tech Company?

The first part of this series took a detailed look at Compass’ growth strategies, fueled by over $1.1 billion in venture capital. The company often refers to itself as a tech company and a tech-enabled brokerage, which is part of the lure of the Compass vision — and the underpinning of its massive $4.4 billion valuation. Now we turn to that fundamental question: Is Compass a tech company, or a traditional brokerage?

Ingredients of a tech company

A real estate technology company that operates as a brokerage (representing buyers and sellers in a real estate transaction) is nothing new. There are tech-enabled brokers around the world: Redfin, Purplebricks, Duproprio, and dozens of smaller players. The defining characteristic of these companies is how technology provides an efficient platform to scale — at rates much faster and at lower cost than traditional brokerages.

A real estate technology company should have the following three attributes:

  • Tech staff: A technology company should employ technologists. 

  • Efficiency: By leveraging technology, operational efficiency should be higher than the industry average.

  • Scalability: Technology should enable the business to scale in a non-linear manner.

This analysis focuses on these key attributes and compares Compass to its industry peers, both technology companies like Zillow and Redfin, and traditional brokerages like NRT (Realogy) and HomeServices of America.

Tech staff

The first clue that a company may be a technology company is the number of software engineers it employs, both in absolute numbers and as a percentage of its total headcount.

Readers that follow my work may recall a previous analysis where I benchmarked the percentage of tech staff at various real estate companies. At the time, I observed that the most successful technology-enabled brokerages around the world (Redfin, Purplebricks, and Duproprio) had around 10 percent technical staff. The point was that the business of buying and selling houses is still very much a people business, even for leading tech companies.

Compass is clearly staffing up and aggressively building a tech team. Compared to total headcount, including agents, the percentage of tech staff is still quite low (reflecting the central role of agents). However, Compass’ tech team represents a significant portion of its salaried, full-time employees.

 
source: compass public statements

source: compass public statements


Many real estate technology companies, including Zillow, Redfin, and Purplebricks, don’t publicly disclose the size of their tech teams. This is where LinkedIn comes in handy. While its employee data is not an absolute representation of the truth, it does provide a helpful comparison between companies.

Looking at software engineering staff as a percentage of the total shows a comparison between companies. (Note: software engineers are just one part of a successful tech team.)

 
source: linkedin, may 2019

source: linkedin, may 2019


Backing out agents (independent contractors or otherwise) from the same calculation shows another way to look at the same data. Remember, this is just software engineers, and not the entire product team.

 
source: linkedin, may 2019, plus author’s estimates

source: linkedin, may 2019, plus author’s estimates


LinkedIn also shows the largest employee categories for each company. The top category for Zillow, which among its peer group is undoubtedly the most tech of the tech companies, is engineering. The same engineering category is ranked #4 for Opendoor, #6 for Redfin, and doesn’t appear until #11 for Compass.

 
Zillow

Zillow

compass

compass


Raw numbers help paint a complete picture. During a Bloomberg interview in April 2019, Compass stated that it currently employs 200 engineering staffers and wants to have 400 by the end of the year. At the time of its IPO in 2017, Redfin had “more than 200 engineers and product managers” (or 9 percent of its staff), and today has nearly 200 engineers. And according to LinkedIn, Zillow has an engineering team approaching 1,000.

On the one hand, Compass is clearly outgunned by tech powerhouses like Zillow and Opendoor, but on the other hand it’s backing up its claims by aggressively hiring a sizable engineering team.

Efficiency

A classic measure of business model efficiency is revenue per person. More efficient and lucrative business models — typically technology companies — are able to generate higher revenues with a smaller staff.

The chart below looks at revenue per person (including agents, which are the drivers of revenue) during 2018. Since Zillow, Redfin, and Compass each grew their headcount rapidly during the year (from 2,600 to 9,500 at Compass), I’ve used a midpoint headcount number to reflect a more accurate representation (6,050 for Compass).

 
Screen Shot 2019-05-08 at 8.17.40 PM.png
 

It’s worth noting that Compass’ target market is the luxury space, with an average home price well over $1 million. Given that a brokerage derives its revenues as a percentage of the sale price, overall revenues will correlate closely with average sale price. The average sale price of a Compass home is about double that of Redfin, yet Redfin still generates more revenue per person than Compass.

Organizational efficiency can be measured by looking at the average number of transactions an agent is able to close each year, called “production.” One would expect a technology company, or a technology-enabled brokerage, to provide its agents greater efficiency through the smart application of technology. Those efficiency gains should translate to the ability to work on and close more transactions.

The chart below compares the average agent production for Compass, Redfin, Purplebricks in the U.K, and the industry average in the U.S.


For this calculation I’ve again used the 2018 midpoint agent count for Compass, raising its average from four to seven transactions per agent, identical to the overall industry average. Redfin’s agents, on the other hand, are 4.5 times more efficient than the industry average — an exponential efficiency gain resulting from technology combined with a novel operating model.

Another way to look at efficiency is not by total agent count, but by total headcount. This method considers the entire organization that, directly and indirectly, supports agents in closing transactions.

 
Screen Shot 2019-05-08 at 8.20.07 PM.png
 

Two interesting things happen in this analysis. First, Compass drops slightly below the industry average (represented by NRT). Second, Redfin’s efficiency lead drops to 2.5 times the industry average, a reflection of how important its non-agent support staff is to its overall model.

Looking at agent efficiency of the top 20 U.S. brokerages shows Compass right in the middle of the pack (which, incidentally, is led by Redfin). Yes, Compass is more efficient than some brokers, but its agents are considerably less efficient than a number of others, many of which don’t even style themselves as “tech-enabled brokerages.” Even agents at traditional industry stalwart HomeServices of America are more efficient.

 
source: Swanepoel Mega 1000

source: Swanepoel Mega 1000


Overall sales volume (the total value of houses sold) per agent shows another angle. Not all houses are created equal, and by being in the luxury space (average home value of $1.3 million), Compass is near the top of the pack when it comes to agent sales volumes. Its agents can sell less homes and still make a considerable amount of money.

 
source: Swanepoel Mega 1000

source: Swanepoel Mega 1000


Combining both average transactions closed and sales volume per agent shows a more holistic view of agent efficiency. Redfin, the clear outlier, operates a model that is exponentially more efficient than the industry average. Compass is clustered with other luxury brands due to its high average sales price.


When evaluating Compass, the evidence shows a business whose agents are no more efficient than the industry average — by a number of different factors. Overall business model efficiency, as evidenced by revenue per person, is singularly driven by being in the luxury market where home prices are high. Technology and product development efforts in 2019 and beyond may deliver on efficiency promises, but for the time being it remains simply that — a promise.

Scalability

Technology businesses should scale non-linearly. They should be able to grow revenues faster than expenses, and leverage technology to become more efficient over time — especially when compared to traditional peers.

Between 2016 and 2018, each of the following businesses grew revenue and added headcount, but all at different rates. Each new hire at Zillow corresponded to around $300k of additional revenue, compared to around $80k for each new person at Compass (slightly below the traditional industry average, as represented by NRT).

 
Screen Shot 2019-05-08 at 8.25.10 PM.png
 

Measuring revenue per person over time gives another sense of business scalability. One would expect a scalable technology business to see efficiency improve over time. The chart below shows the changing revenue per person — including agents — over the span of three years, again using a midpoint count in 2018 due to the rapid headcount growth in all three businesses.

 
Screen Shot 2019-05-08 at 8.22.19 PM.png
 

The evidence shows a clear trend: each business is generating revenue more efficiently as it scales. That trend is more pronounced at Zillow and Redfin, and is the hallmark of a scalable business model.

Compass is scaling differently, and less efficiently, than its peers. This does not mean that Compass is any better or worse than Zillow or Redfin — there are a variety of business models, each with their own merits — just that it is a different type of business.

The valuation quandary

Is Compass worth $4.4 billion? Should Compass be valued as a traditional brokerage, or a technology company?

The disruptive companies leading the pack in real estate — Zillow, Redfin, Opendoor, and Purplebricks — all combine technology with a novel operating model different than a traditional brokerage. It is this combination that leads to exponential gains in efficiency.

Regardless of whether or not Compass is a technology company, it unquestionably needs to be a technology company — both to support its massive valuation of $4.4 billion, and to be a lasting, sustainable business. This topic is explored further in Part Three: Valuation.

Inside Compass — Part 1: Growth Strategies

Compass is one of the world’s proptech unicorns. With a valuation of $4.4 billion and over $1.1 billion in venture capital raised, this self-styled technology-enabled broker is now the third largest U.S. brokerage by sales volume.

But how has it grown so quickly? What’s the secret to its meteoric rise, and what is it that investors see that justifies its massive valuation? This multi-part deep dive into Compass looks to provide evidence-based answers to those questions — and more.

Fundraising and growth drivers

Compass’ fundraising prowess sets it apart from its peers. It is one of the select few real estate tech companies that has raised over $1 billion in equity (Opendoor is another), and counts SoftBank as one of its investors.

Compass raised its first capital in 2012, but it was not until recently that it started raising mega rounds: $550 million in 2017 and a further $400 million in 2018.


Compass has seen a corresponding increase in its revenue and transaction volumes. Revenue has consistently doubled over the past several years as the company has become the third largest U.S. brokerage in terms of sales volume. It completed around 35,000 transactions worth $45 billion in 2018.

 
Source: author’s estimates from numerous company statements.

Source: author’s estimates from numerous company statements.


In a relatively static world of real estate market share, Compass is clearly making an impact and seeing strong growth. And its growth strategy is as unique as its fundraising ability.

A New York Yankees growth strategy

Beginning in a big way in 2016 — after a $75 million cash infusion — Compass began a new strategy of growth through acquisition.

Over the years, several sports franchises around the world, including the New York Yankees, Real Madrid, and Chelsea Football Club, have executed a particular growth strategy based on their competitive advantage: access to capital. All three clubs are rich, have access to massive amounts of capital, and use it to buy the best players in the world.

Compass operates a similar strategy; its competitive advantage in the market is capital (over $1.1 billion of it). The Compass strategy is to deploy that capital by luring the best agents and brokers to its team. Like all real estate brokerages, agent count is the primary driver of revenue.

 
Screen Shot 2019-05-02 at 9.31.21 AM.png
 

Compass employs a number of methods to attract the best talent: high commission splits, bonuses, marketing funds, and stock options. These financial factors are in addition to the softer benefits of the Compass brand, which is slick, modern, exclusive, luxury-focused, and comes with the promise of marketing and technology support (this will be explored further in Part Two: Brokerage or Technology Company).

Beginning in 2018, immediately after its massive $550 million cash infusion, Compass upped the game by acquiring brokerages wholesale. Instead of luring away only the star players, management decided it would be faster to simply acquire entire brokerages, which significantly accelerated the growth of Compass’ agent count (note the blue line in the graph below).

 
Screen Shot 2019-05-02 at 10.19.12 AM.png
 

Since the start of 2018, Compass’ agent count has increased from roughly 2,000 to 10,000. Of those 8,000 new agents, around 4,200, or 52 percent, came from acquired brokerages. The remainder can be assumed to come from traditional, organic methods (recruitment of star agents and teams).

 
Screen Shot 2019-04-29 at 3.01.29 PM.png
 

Steve Murray from REAL Trends, whose firm closely tracks and values U.S. brokerages, estimates that the acquisitions listed above cost Compass a total of between $220 and $240 million, paid in a combination of cash and stock. Compass has stated that it typically pays between four and six times a firm’s annual pre-tax earnings.

Assuming a total of $230 million spent to acquire fourteen brokerages with 4,200 agents, that’s a cost of $55,000 per agent. Quite an expensive — and effective — recruitment method.

Marketshare merry-go-round

The real estate world revolves around agents. Agents generate revenue, and that revenue gets split between agent and broker. Each year, many agents change brokerages in an effort to increase their earnings through incentives like more favorable commission splits. It’s a recruiting tool.

This marketshare merry-go-round has been going for decades. There’s always a new player entering the market with a sweet deal to attract agents with the promise of earning more money. Today, that’s Compass and eXp Realty. But what about tomorrow? What’s to stop the next wave of players offering an even better financial proposition to lure agents to its ecosystem?

Compass has achieved a tremendous amount of growth in a relatively short period of time, and its competitive advantage is access to capital. It is parlaying that advantage into a massive agent recruiting tool at scale. But that advantage may not be sustainable nor unique; it’s possible for others to copy. Nothing is stopping a new or existing player from offering even more lucrative deals to attract agents.

Brokerage or technology company?

The vision, promise, and lure of Compass is that it’s a technology company, not a traditional real estate brokerage. And as a technology company, it will deploy tools unmatched by others in the industry. This potential competitive advantage will be key to attracting and retaining agents, and a cornerstone of the Compass strategy.

Using extensive data as evidence, part two of this series explores that singular, key question upon which this $4.4 billion company revolves: Is Compass a brokerage, or a technology company?


Inside Compass: A Strategic Analysis

My epic, five-part Compass analysis in one easy to read whitepaper. Download the free PDF and enjoy!

Also check out the rest of my strategic, evidence-based analysis of Compass.

The Rise (and Fall?) of Purplebricks

If you believe everything you read in the media, you could be excused for thinking the U.K.-based online real estate agency Purplebricks is a company in crisis. The stock price is significantly down from the highs of last year, the U.S. and U.K. CEOs are out, and revenue guidance has been repeatedly downgraded.


Purplebricks faced a rocky international expansion, especially in the U.S. In a span of nine months, it quietly raised prices, completely pivoted its fee model, and then parted ways with its U.S. chief executive. During the same period, it lowered future revenue expectations not once but twice, down from total group revenues of £185 million to £140 million.


But like all irrational systems, the stock market trades not only on reality, but the perception of reality. While Purplebricks' stock has faced a turbulent three years, its underlying revenue has consistently grown by impressive margins.


The sharp rise in 2017 was driven by unrealistic optimism for international expansion, on the back of 100% growth in the U.K. In 2018 it was clear international markets were a tough nut to crack, while U.K growth slowed considerably.

Still strong in the U.K.

As I wrote in July 2018, Purplebricks' U.K. business model works, it makes money, and -- at scale -- is profitable.


It's a mistake to confuse Purplebricks' stock price with its overall success. The only challenge facing the U.K. business is growth, which is clearly slowing down as the company saturates the market. All online agents are not doomed to failure because of some fundamental flaw. 

Market share can only get so high. In November 2018 I was quoted in the Financial Times saying, "I rolled my eyes when analysts were talking about 20, 25 per cent market share [for digital leaders]." And it's true. Depending on the source, Purplebricks' U.K. market share is anywhere from 3.2 to 4.5 percent.

What's the problem in the U.S.?

The U.S challenge is simple: Purplebricks' massive marketing spend is not generating enough customers.

The company recently pivoted its business model in the U.S., from an up-front fixed fee (paid regardless of the home selling), to a success fee paid only when a home sells -- both at a discount. This move brings Purplebricks squarely in line with the traditional industry it was attempting to disrupt. The proposition is now also identical to Redfin.

In December of 2018, I estimated Purplebricks generated between 1,200 and 1,400 new listings over the preceding six month period. During that same time, Redfin reported around 22,000 closed transactions.

Also during that period of time, Purplebricks spent over $20 million in marketing, compared to Redfin's $16 million. The result is a customer acquisition cost of $15,000 for Purplebricks, compared to $730 for Redfin.

 
0b3baf87-5fa2-476b-85e7-5d0f24d276ae.png
 

Strategic implications

Purplebricks is still dangerous: it has deep pockets, a willingness to spend, and the self-awareness to pivot when things aren't working. I wouldn't count them out of the U.S. quite yet.

The biggest implication, however, could be the massive amount of money being spent on marketing by disruptive players (over $100 million between Purplebricks and Redfin alone in 2019). And what's the message of that marketing? Traditional agents are expensive, we offer the same service at a discount, use us instead.

Expand the scope to iBuyers like Opendoor and Zillow and the tens-of-millions they are spending on marketing. What's the message? Traditional sales are complicated and confusing, use us instead.

Disruptive companies are spending hundreds-of-millions of dollars on TV commercials, radio ads, and online advertising that hammers home a clear message to consumers: a credible alternative to traditional real estate.

Now, more than ever before, consumers are being bombarded with advertising offering them a choice. The industry may not change overnight, but consumers will be asking more and more questions.

iBuying is Zestimate 2.0

When Zillow launched in 2006, its Zestimate was its claim to fame.

The Zestimate was a lead generation tool that attracted consumers by giving them a starting point for determining what their home -- or any home -- is worth. It was online, it was fast, and it was easy.

Flash forward more than a decade later, and online valuation tools are a commodity. There are dozens of web sites that will determine a home's estimated value. Zillow’s unique advantage has diminished.

Zillow's strategic necessity

I believe Zillow's guiding strategic principle is that it must be consumers' first destination in the home buying and selling process. Zillow's sustainable competitive advantage lies in its massive audience and strong position at the start of the consumer journey.

In the past, other listing portal competitors were relatively undifferentiated. Zillow has been the clear market leader, and there was no credible threat that could unseat it from its powerful position.

However, the entry of iBuyers with a service that made instant offers on a home – online – was novel and compelling, just like the Zestimate in 2006. Suddenly, more and more consumers were beginning their home selling process not on Zillow, but on other web sites like Opendoor and Offerpad. This was a key existential threat for Zillow.

The iBuyer business model is Zestimate 2.0 – the natural starting point for determining your home’s value. What’s more accurate than an actual offer on your home?

Mass-market appeal

Opendoor's long-term vision is that every home owner will request an instant offer before selling their home. It's a natural starting point: It's easy, it provides value, and there's no commitment. What better way to value your home than an actual offer?

While Zillow only purchases around three percent of the offer requests it receives (that number is higher for the other iBuyers), a very large number of consumers are requesting offers each month. In established markets like Phoenix, anywhere from 25–35 percent of active home sellers request an instant offer before selling their home. The numbers are BIG.

 
fa500a88-4c85-4fd6-96d0-93b0e00cfe93.png
 

Given the growing mass market appeal of an instant offer (tens of thousands of requests each month) and the simplicity of the process, it's no surprise that Zillow launched its own iBuyer service.

Strategic implications

If you're in the business of providing consumers an estimate of the value of their home, the bar has just been set higher. The inherit power and appeal of the iBuyer model is quite clear:

  • Instant offers are simple, easy, and quick. All online.

  • Instant offers are at the start of the funnel -- they attract consumers at the start of the home buying or selling journey.

  • It's a novel concept that satisfies a consumer need, hence the high proportion of consumers requesting offers.

In other words, iBuying is the new Zestimate.

Rightmove's slowing growth: same problem as Zillow, different strategy

Rightmove, the U.K.'s top portal, announced its full-year 2018 results last week.

Why it matters: Not unlike Zillow, the growth in Rightmove's core advertising business continues to slow. The slowdown in velocity reveals the limits and highlights the challenges the business will need to overcome as it looks for new growth opportunities.

Overall revenue grows and slows

Overall revenue at Rightmove grew 10 percent last year -- respectable, double-digit growth, but also the lowest number recorded in its history.

 
68003b2b-ec3c-4731-ba35-b8c32321d00d.png
 

Rightmove's core revenue driver is its Agency business, which accounts for over 75 percent of total revenue (concentration risk!). Annual growth continues to slide over time. The 8.7 percent growth is the lowest number recorded, and reflects the growing difficulty the business has in charging its customers more money for the same service.

 
24da7cd0-4e58-4be7-8481-a5648324c8cf.png
 

Nearly all of Rightmove's growth is coming from price increases (average revenue per advertiser, or ARPA), as opposed to new customers. The amount that Rightmove is able to squeeze out of its existing customers is slowing over time.


Controlling expenses

Historically, Rightmove has demonstrated incredibly disciplined cost control. By managing its expenses, Rightmove is able to maintain its phenomenal 76 percent profit margins.


But while good for the bottom line, controlling expenses too much can limit the ability of a business to invest in future revenue streams.

One way Rightmove maintains its margins is limited headcount growth. In 2017 (which was a transition year when revenue growth slowed considerably as new pricing was rolled out), the business only added ten new hires. In 2018, Rightmove added sixteen new hires.

 
7c320a2d-8179-4360-ac67-d41138b89415.png
 

Strategic implications

While facing similar challenges, Rightmove's strategy stands in stark contrast to nearly every other major real estate portal around the globe. Zillow and REA Group spent tens-of-millions of dollars to acquire mortgage businesses, Scout24 acquired a finance comparison business for over $300 million, realtor.com acquired Opcity for $210 million, and Zoopla acquired a range of adjacent businesses for half-a-billion pounds.

The real estate portal business is evolving, moving closer to and getting involved in more parts of the transaction. But Rightmove has remained steadfast and stationary in its solitary focus (more on this in my Future of Real Estate Portals Report and 2018 Global Real Estate Portal Report).


Rightmove's revenue growth slowdown may sound similar to Zillow (as I wrote about last week), although the slowdown is less pronounced and immediate. But the trend and concern is the same.

Both portals are facing slowing growth in their core businesses. Zillow has invested heavily in new business lines (mortgage, rentals, Zillow Offers, and lead qualification to name a few) and appointed a new CEO, while Rightmove hasn't -- its eggs are still in the same basket.

Zillow's New Strategy: Insights, Implications, and Analysis

Last week, Zillow announced a major strategic shift: Along with a new CEO, it made clear that its top focus is its Zillow Offers iBuyer business.

Today's email covers the highlights of that announcement. Additionally, next week I'll be holding a 60-minute webinar that dives deep into the strategy, numbers, and implications of Zillow's latest move.

Screen Shot 2019-02-25 at 7.39.23 PM.png

Premier agent growth grinds to a halt

The most striking statistic from Zillow's results is the lack of projected growth in its flagship, billion-dollar premier agent program (which accounts for 67 percent of its revenue). Guidance for the first quarter of 2019 is only 1.5 percent -- a steep decline from past quarters.


And on a full-year basis, Zillow projects its premier agent program will grow at 2 percent -- a flattening from past, double-digit growth.


Both of these projections come on the back of difficulties rolling out new premier agent products focused on lead quality over quantity.

But what's most striking is the suddenness of the decline. Going from double-digit to flat growth in the span of a year is significant. More than rollout issues, I believe Zillow has reached the upper limit of what it can charge agents for leads. Which is what's driving such a significant shift in strategy.

Expensive homes and a longer hold time

Last week I wrote about Zillow's unsold inventory in its Offers program, and the significance of longer hold times. The latest data highlights the same challenge.


The homes Zillow sells are less expensive: an average sale price of $292,000. However, the houses it holds in inventory are considerable more expensive, with an average value of $320,000.

This data point matches up exactly with the latest data from Phoenix, which shows a considerably higher average purchase price for Zillow compared to the other iBuyers.


The more expensive the home, the higher proportion of unsold inventory. It takes longer to sell more expensive homes, and it looks like Zillow is more than dabbling in the expensive end of the market. This is a key metric to watch!

Profit projections

Zillow released a detailed financial breakdown for its Offers business, including initial profit margins on its sold homes. Adjusted EBITDA, which backs out a number of costs including stock-based compensation, shows a per-home profit margin of 0.6 percent, lower than the stated goal of 2–3 percent.


(As a form of employee compensation, I believe stock-based compensation should be included in a true EBITDA calculation, so I've provided both options above.)

It's still early days, but this benchmarks current performance compared to where the business needs and wants to go in the future.

Strategic implications

I believe Zillow's guiding strategic principle is that it must be consumers' first destination in the home buying and selling process. Zillow's sustainable competitive advantage lies in its massive audience and strong position at the start of the consumer journey.

Think of this latest move as "Zestimate 2.0." The original Zestimate gave consumers a fun and helpful starting point when thinking about moving or buying a house. Now that online valuations are a commodity, Zillow needs to up the game: Instead of an estimate of value, how about an actual offer on your house? It's a compelling consumer proposition -- even if it simply serves the same purpose as the original Zestimate (attracting consumers at the start of the journey).

There's a whole lot more to discuss! If you want to listen and watch as I dive deep into the subject, register for next week's webinar.

Zillow Offers' most important metric


Later today, Zillow will announce its fourth quarter and full year 2018 results. Its activity as an iBuyer continues, and it recently overtook Offerpad to become the second-largest iBuyer in Phoenix. But my attention is focused on one key metric: Zillow's ability to quickly sell houses.

Why it matters: Zillow's goal is to hold houses for an average of 90 days. Any successful iBuyer needs to hold houses for as little time as possible, otherwise unsold inventory builds up, finance costs rise, and the whole model starts to blow up.

Overall activity grows; #2 in Phoenix

Zillow's overall iBuyer activity continues to grow, both nationally and in Phoenix (its biggest market). Based on the total number of homes purchased and sold, Zillow overtook Offerpad to claim the #2 spot in Phoenix for the month of January. Zillow is -- for the moment -- the second-largest iBuyer in the important Phoenix market.


Buying more than it's selling

While Zillow's overall activity continues to rise, its purchases are quickly outpacing sales. This is to be expected in the early months of a new market, but it's now eight months since launch. This is creating a growing inventory of unsold homes: around 350 in Phoenix as of February 12th.


It's natural for iBuyers to buy more houses than they sell when entering a new market. But over time, this Buy:Sell ratio is a critical metric for any iBuyer. Houses must be sold for the business to work!

Expensive homes, longer hold time

There are early signs that Zillow may be having difficulty selling houses. For iBuyers, time is money. The faster they can turn around and sell a house, the better.

The magic number for total holding time is around three months; Opendoor and Offerpad hold for between 80-100 days. Zillow currently has around 350 unsold houses in its inventory in Phoenix. Of those, it appears that around 110 homes have been owned for more than three months.

Part of the reason Zillow appears to have longer holding times may be the price of the homes it is purchasing. On average, it is buying more expensive homes than the other iBuyers in Phoenix.


Nationally, Zillow has purchased over 700 homes with an unsold inventory of over 500 homes.


The more expensive the home, the higher proportion of unsold inventory. It takes longer to sell more expensive homes, and it looks like Zillow is more than dabbling in the expensive end of the market.

Strategic implications

The key metric to watch is how well Zillow can sell its houses. Buying is relatively straight-forward; only once a house is sold is the entire business model complete.

To succeed as an iBuyer and appropriately manage its risk, Zillow needs to hold its houses for a minimum amount of time (on par with the other iBuyers), and avoid building up a large inventory of unsold homes.

It's still early days and Zillow has been quite aggressive in growing as fast as possible. But with its one year anniversary four months away, the pressure is on to demonstrate a consistent ability to buy -- and sell -- houses.

My Inman Connect Presentation

Earlier this month I had the pleasure of presenting at Inman Connect in New York City. My session, "iBuying Goes Mainstream: How Big Can it Get?" covered a range of topics, from the evolving role of portals to the latest iBuyer analysis.

My key points are outlined below. Watch the video of my presentation and download a copy of my presentation slides.

Growing iBuyer traction

The rise of iBuyers continues. During my presentation, I shared some of the latest national data available; a "sneak peak" at my upcoming iBuyer Report.

Opendoor in particular continues its strong growth in terms of houses bought and sold, clearly accelerating in 2018. Overall, iBuyers are small but growing: around 5 percent of the market in Phoenix.


The consumer journey

If you're an Inman subscriber, you can read the provocatively titled writeup of my presentation, "Opendoor's 'nightmare': KW agents backed by their own iBuyer." To quote:

 His point is that Opendoor, a tech-powered homebuying and selling startup with $1 billion in venture capital, is vulnerable to competition from companies that already connect with consumers on a massive scale at the beginning of their home-buying or selling journey.

Who wins?

The best new business models are exponentially better than the status quo, and the biggest companies are exponentially outspending their competitors.

Whether it's materially better efficiency with models like Redfin and Purplebricks, or Opendoor raising (and spending) 10 times the capital than its nearest competitors, the stakes are big. The trends that are impacting the industry are not incremental.


My presentation

You can watch the video of my presentation, and download a copy of my my presentation slides. I'd love to hear your feedback!

REA Group, Domain, and the non-battle for top spot

It's earnings season! In the past week, a number of portals announced their financial results, including REA Group and Domain, the two top Australian portals.

Why it matters: The numbers reveal interesting trends and insights, significantly around the difficulty of building meaningful adjacent businesses, and the non-battle between the #1 and #2 players in various markets.

Adjacent businesses are tough

Like many portals worldwide, REA Group and Domain each launched adjacent businesses, with goals to expand along more of the transaction, reduce consumer friction, and capture more revenue.

But as I've written before, the businesses have very different strategies. REA Group acquired a majority stake in an existing mortgage broking business, while Domain launched a number of joint ventures and partnerships. Different strategies, different outcomes.

REA's finance business continues to chug along, building revenue and generating meaningful earnings ($5.8 million EBITDA over the last six months).


By comparison, Domain's adjacent businesses (finance, insurance, and utility switching) generate similar revenues but with continued -- and mounting -- losses. The latest six months show a loss of $4.3 million.


REA's strategy is delivering a positive financial impact, while Domain's businesses are still in a heavy investment phase after more than a year.

The "battle" between #1 and #2

The battle between the #1 and #2 portal in each market is fascinating, and Australia is no exception.

One metric to compare portals is overall revenue generation. In general, the #2 portal generates between 25 and 40 percent the revenue of the leader (read my portal report), and that number doesn't fluctuate over time. In fact, in the case of REA Group and Domain, the leader is growing faster than the number two.


Domain is the underdog in Australia, and the evidence suggests it will remain that way. Overall situational awareness is important: It would be a mistake to assume Domain will overtake REA in any capacity.

U.K. portal wars -- what's changing?

Along the same lines, the real estate portals in the U.K. recently released traffic figures for the start of the year. It offers yet another fascinating glimpse into the competitive tension between top players -- and the complete lack of movement.

The figures released are for January 2019. And while the absolute numbers are generally rubbish, it's the comparison between portals and the year-on-year growth that's insightful.


Rightmove's numbers have hardly changed, and the delta between the number one and two is still the same. For all the investment on product, marketing, and inventory -- the all important consumer habits haven't shifted.

The variable, however, is the upstart portal OnTheMarket (read my past analysis). OTM has raised over £30m and is aggressively spending on marketing in order to drive traffic to its site. Its traffic has doubled since last year -- but does it matter?

For all of the tens-of-millions of pounds spent to build an alternative to the established portals, what impact is it having after launching four years ago? Zoopla's traffic is marginally down, but it reports that leads are up over 30 percent. The top two portals are equally and exactly as dominant as they were a year ago.

Strategic implications

There are a number of key takeaways for portals around the world:

  • Launching successful adjacent businesses is hard. It takes an incredible amount of investment, and there are a variety of execution strategies.

  • The evidence doesn't suggest that the #2 portal can overtake the leader -- let alone make a dent in its leadership position. It's not a horse race; it's static trench warfare.

  • Trying to launch a new portal and compete against the leaders is at best expensive, and at worst futile. Consumer habits are hard to change.

Zoopla's private equity strategy shift

Zoopla recently announced that it has removed all non-property advertising from its listing pages. This is one of several significant strategy changes after its acquisition by private equity firm Silver Lake.

Why it matters: The benefit of being a private company is that Zoopla can be more aggressive, focus on longer-term opportunities, and be less sensitive to a stock price that focuses on short-term earnings growth. This move is an example of that strategy in action.

The advertising revenue dilemma

A number of real estate portals generate revenue from non-property advertising on their listing pages. Zoopla's move puts it in line with arch-rival Rightmove by banishing banner ads from listing pages.

Note: REA Group and Domain do not have advertising on featured property listings, but do have non-property advertising on "normal" listings.

Note: REA Group and Domain do not have advertising on featured property listings, but do have non-property advertising on "normal" listings.

Banner advertising can be an important source of revenue for portals. However, it comes at the expense of the user experience. If a visitor clicks on a banner ad, their attention is diverted away from the property listing, reducing its effectiveness.

Often times user experience loses out to finances, especially for publicly listed companies under pressure to deliver revenue growth. And given that core revenue growth is slowing at a number of mature portals, the decision is even harder. But for a private company that's focused on the long-term opportunity, the decision is easy.

A shift in strategy

Aside from jettisoning nearly its entire management team, Zoopla has been up to quite a bit post-acquisition; there is the appearance of a significant change in strategy.

Zoopla's aggressive diversification strategy has been a leading factor making it unique in the world of real estate portals. It's been a world leader in acquiring adjacent businesses to dramatically grow revenues (for more on this, check out my 2018 Global Real Estate Portal Report).

274af871-ee65-4308-8ad8-fa224d17114c.png

The company's narrative has centered around a cross-sell strategy, where acquisitions are deeply integrated across Zoopla's network of web properties.

I've questioned the effectiveness of the cross-sell strategy, most recently in my Future of Real Estate Portals Report. The evidence didn't suggest a runaway success when it came to integration and cross-sell synergies.

Notably (and here's the big strategy shift), Zoopla's new managing director recently stated that, "Going forward, the former comparison and property businesses of ZPG will be managed largely separately, but we will continue to achieve synergies between the two wherever it is appropriate and relevant.”

To me, that sounds like a "back to basics" approach with a deep focus on the core product: tools for agents with a fantastic consumer experience. Cross-sell synergies and deep integration across the portfolio are taking a backseat.

Which is an interesting development for Scout24, which recently purchased financial comparison site Finanzcheck for $330 million, and Domain, which has been running the Zoopla diversification playbook for some time. Oops?

Strategic implications

Public companies that are focused on short-term revenue growth are at a distinct disadvantage to private companies backed by private equity. And private equity is getting more involved in the sector:

  • General Atlantic acquires a majority stake in Hemnet, December 2016.

  • Silver Lake acquires Zoopla for £2.2 billion, May 2018.

  • General Atlantic invests $120 million in Property Finder, November 2018.

  • Apax Partners offers $2.5 billion NZD for Trade Me, December 2018.

  • Rumors circulate that several private equity firms are looking at Germany's top portal, Scout24.

It's going to be difficult to compete with private equity-backed portals given their fundamental advantage: they can be more aggressive, focus on longer-term opportunities, and be less sensitive to a stock price that focuses on short-term earnings growth.

Axel Springer goes all in on hybrid agents

How many international media conglomerates -- that own a number of leading real estate portals worldwide -- have “hybrid agents” as one of its top strategic priorities? Just one: Axel Springer.

Why it matters: Axel Springer, the $6 billion European media house, is going "all in" with online hybrid agents, through its investments in Purplebricks and Homeday. It's making a calculated bet that competing with its real estate agency customers is the best long-term strategy.

Making hybrid agents a strategic priority

Dozens of the largest real estate portals around the world are owned by a small collection of international media companies: News Corp, Schibsted, Naspers, and Axel Springer. But of them all, only Axel Springer has taken the step of investing in a potential sector disruptor: the online hybrid agent.

Axel Springer owns major real estate portals in France, Germany, Belgium, and Israel. In March 2018, it made a bold, £125 million investment in Purplebricks. The investment is notable because Axel Springer owns several top portals whose customers are the same real estate agents that Purplebricks is trying to disrupt (albeit in different markets).

Furthermore, Axel Springer is the only major international entity that has targeted online hybrid agents as a future growth priority. In its latest presentation to investors, hybrid agents are included as a top priority for the core classifieds business (which generated revenues of over €500 million in 2017).

Disrupting its biggest customers

Axel Springer's strategy offers a fascinating juxtaposition: Adding value to traditional agents by providing more services (seller leads), while "satisfying even more consumer needs" with its hybrid agents -- which directly compete with traditional agents.

6940f74d-bf19-4e12-8794-d4893023dd1f.png

Axel Springer is wonderfully upfront about its motivations. Its move into the hybrid agent space is designed to tap into a much larger revenue pool: agent commissions.

efdef2ce-654a-48c4-9bf7-a56633e24f3b.png

Continuing to serve your customers while entering into direct competition with them is a delicate balancing act. It's a move reminiscent of Amazon promoting its own products in direct competition with many of its sellers.

This is the nightmare scenario that U.S. real estate agents have been predicting for years. But in this instance it's not Zillow, but one of Europe's most powerful players, taking active steps to disrupt agents.

Winner take most

It's been clearly illustrated in the U.K. market that the online agent space is winner take most (market share). Access to capital is the single biggest predictor of success.

There is no first mover advantage in these markets (Purplebricks was not the U.K.'s first online hybrid agent). Rather, there is a rich first mover advantage: the business with the deepest pockets generally wins.

In this regard, Axel Springer and Purplebricks form a powerful combination. From a competitive standpoint, the most dangerous thing about Purplebricks is its investment risk tolerance. It is willing to invest tens-of-millions of dollars year after year to build market share -- incurring big losses along the way. And with Axel Springer and its deep pockets along for the journey, it's a hard combination to beat.

Strategic implications

Axel Springer and Purplebricks are quickly building a potentially insurmountable lead in the online hybrid agent space globally. There is no runner-up in the sector; it's a one horse race.

Purplebricks has proven the online hybrid model works in the U.K., and is aggressively launching in other markets. Copycats are popping up around the world. What's stopping News Corp, Schibsted, and Naspers from entering the space? It's either capital, ambition, or fear of upsetting their agent customers.

Real estate portals are moving from search engine to service engine; they are moving closer to and becoming involved in more of the transaction.

There is undeniable momentum in this direction. While not every portal is seeing success, the shift is clear -- and unyielding. Axel Springer's bet on online hybrid agents, in direct competition with its real estate agent customers, is the latest example of this evolving strategy.

2018 in Review

e5a161f4-bf44-4b9a-b0d4-325ff3033cc0.png

What a year! In 2018, I published a massive amount of insightful, data-driven analysis of the global real estate tech landscape, and started as a scholar-in-residence at the University of Colorado Boulder. I'll cover the highlights below, but first a look ahead.

Themes for 2019

Next year, my work will focus on three main areas:

  • Big real estate portals aggressively launching new revenue streams in adjacent businesses, moving from search engine to service engine.

  • New models continuing to gain traction, with accelerated expansion in mature markets and start-ups launching everywhere else.

  • Traditional real estate incumbents around the world taking note and reacting -- some better than others.

2018 Highlights

Three huge reports

I released three reports: the 2018 Emerging Models in Real Estate Report (33k views), the 2018 Global Real Estate Portal Report, and the Future of Real Estate Portals.

Zillow and iBuyers

I conducted a deep analysis of Zillow's strategic shift, how Zillow and Opendoor are controlling the consumer journey, and the billion dollar seller lead opportunity.


Disruptive new models

Looking broader, I asked if Compass really is a tech company, and
analyzed online agent consolidation in the U.K. and how psychology is holding back real estate tech.

Strategy consulting

I've worked exclusively with the world's leading and most promising real estate tech companies and portals (you know who you are, and thank you), conducting strategy reviews and ongoing advisory work.

14cab999-6e8c-4460-ae9c-804fe86b8787.jpeg

Keynote presentations

From San Francisco to Oslo, Dubai to Berlin, I've delivered top-notch insights in person to the biggest companies and leaders in the field. Read some testimonials.


University course

I started teaching real estate tech at CU Boulder, with amazing industry guest speakers from companies like Trulia, Opendoor, UDR, Open Listings, ATTOM Data, and more.

05d3b6f8-03a8-4f8f-b16e-3769ec4ddd20.jpg

Investments in real estate tech

During the course of 2018, it's been my pleasure to join world class investors like Axel Springer, Kleiner Perkins, Stereo Capital, Lightspeed Ventures, Breyer Capital, and Schibsted Media as a personal investor in or advisor to real estate tech companies ZumperFastfoxKodit.ioTall Poppy, and AirDNA.

An exciting year ahead

I'm looking forward to exploring new opportunities and applying my expertise to new challenges in the year ahead. I'll drive myself to continue to be -- in the words of one of my readers -- "the most reliable source for data-driven, strategic insights in the industry."

My Proptech CEO Summit Presentation

It was my pleasure to present at the invite-only Proptech CEO Summit in San Francisco, hosted by former Trulia execs and current venture capitalists, Paul Levine and Pete Flint. There were over 100 proptech CEOs present, including Glenn from Redfin, Eric from Opendoor, and many others.

I want to share my entire presentation from the event, in addition to highlighting a few key points.

PropTech and PropPsych

The first point deals with the critical role of human psychology in real estate transactions, and the concept of loss aversion (for more, check out How Psychology is Holding Back Real Estate Tech).

Human psychology is the single biggest obstacle to mainstream adoption of new technologies in real estate. The point I made in my presentation is this: every venture capitalist should be asking proptech start-ups how they are going to address loss aversion.

And the inverse is true: each startup should clearly explain how its product or service is designed to minimize loss aversion in consumers.

Building the technology alone is not enough. Real estate tech companies need to assure consumers their product is just as "safe" as the status quo. PropPsych is just as important as PropTech.

Solving problems with money

The second point relates to the massive amounts of money flowing into the ecosystem. To quote Glenn Kelman, "If we can afford to lose money for five years, how can we ever make money?"

The biggest players in the space -- Opendoor, Purplebricks, and Compass -- have raised hundreds of millions to over a billion dollars each. The next tier of start-ups have raised tens of millions of dollars each.

But none of these companies are actually doing something new; they're doing what's possible with massive amounts of capital.

Yes, there are novel aspects of the business models that allow these business to realize gains in efficiency, or provide a superior customer experience. But all are underpinned by massive amounts of capital.

The reason that Compass can buy market share, Purplebricks can generate tons of leads through advertising, and Opendoor can buy thousands of homes is access to vast amounts of capital.

My presentation

Attached below is a link to my presentation on Slideshare (you can also download the PDF). Unlike my numerous industry reports, this is designed to be delivered in person. But hopefully it helps you and your business.

Purplebricks' H1 2019 Results

Last week, Purplebricks released its half-year financial results. The top line results include an overall group loss of £27.3 million for the period, with a slight reduction of its full-year revenue guidance. But the top line numbers don't come close to telling the full story (hint: it's not as bad as it sounds).

Why it matters: Purplebricks' core U.K. market continues to grow and is meaningfully profitable, proving that the model works. Key performance indicators in its other three markets reveal a deeper story of investment, growth, and challenges.

Continued growth in the U.K.

The popular narrative is seductive, but factually incorrect: With massive losses at Purplebricks and the demise of online agent Emoov (which, by the way, was not the second largest online agent in the U.K.), the entire online agency business model is near collapse. Not quite.

Purplebricks is an international collection of businesses at various stages of growth. In the U.K., Purplebricks' most mature market, it continues to grow revenues and operating profit. At maturity and scale the business model absolutely works; there is no evidence to support otherwise.

Yes, growth is slowing in the U.K. But at nearly 80,000 instructions per year it can't be expected to keep growing at historic rates. The key is that even in a challenging economic climate, growth continues.

Bumpy ride in Australia

While progress in the U.K. is consistent and positive, Purplebricks' Australian operation has endured a turbulent year. Senior management changes, a business model pivot, and its fair share of negative press has resulted in a "bump in the road" over the last six months.

Revenue growth is up year-on-year, but down from the previous six months, with a corresponding hit in operating profit.

One data point does not make a trend, so all eyes are on the next six months as Purplebricks executes its Australian turnaround plan with a new team and new pricing strategy.

Deep investment in the U.S. market

Purplebricks continues to invest heavily in its U.S. rollout. Over the past six months, it has spent over $20 million on sales and marketing across seven States -- more than double what it spent last year.

Purplebricks managed between 1,200 and 1,400 instructions in the U.S. over the past half-year, or around 200-230 per month. The cost per instruction has dropped from around $21,000 to between $14,000 and $17,000 (each instruction is worth $5,205 in revenue to Purplebricks).

At the current rate, Purplebricks will need to go from 200 to 650 instructions per month to reach breakeven with its sales and marketing costs, and to 1,000 instructions per month to reach profitability.

To achieve profitability, Purplebricks will need to get all of its launch markets performing well, not just L.A. One example is the lackluster performance in Phoenix, as I wrote about last week.

Marketing efficiency

At its core, Purplebricks is as much an advertising company as it is a real estate company. The business model relies on a massive marketing expenditure to generate leads for its network of agents. Thus, one of the most important metrics for the business is marketing efficiency.

For every £1 spent on marketing, Purplebricks generates revenues of £3.60 in the U.K., £0.92 in Australia, £0.36 in the U.S., and £4.38 in Canada (Purplebricks' Canadian acquisition was a fantastic deal).

Strategic implications

The core Purplebricks business model -- and profitability at scale -- is sound. The market failure of smaller players, or the fact that Purplebricks is deeply investing in new markets, doesn't diminish that fact.

From a competitive standpoint, the most dangerous thing about Purplebricks is its investment risk tolerance. It is willing to invest tens-of-millions of dollars year after year to build market share -- incurring big losses along the way. If you're a traditional real estate agency, or a listed company, are you willing to do the same?