Zillow, Power Buyers, and the Challenge of Attaching Mortgage

In 2018, Zillow set itself lofty goals when it entered the mortgage business. Three years later, Zillow's actual performance is far, far below its predictions, highlighting how difficult the mortgage space is, not just for Zillow, but for every real estate tech company targeting mortgage as a lever for growth.

Setting High Expectations

Zillow's 2018 Annual Report, released after Mr. Barton assumed the CEO role, clearly set out the company's 3–5 year goals in mortgage:

Mortgages Segment

  • Zillow Home Loans achieves a 33 percent attach rate to Zillow Offers, up from zero in 2018.

  • Zillow Home Loans originates more than 3,000 loans per month, up from nearly 4,000 MLOA loan originations in all of 2018.

The 33 percent attach rate to Zillow Offers is down from the lofty 75 percent attach rate quoted earlier by Mr. Rascoff in Zillow's 2018 second quarter earnings call:

"So for anybody who is wondering why we just bought a mortgage lender, just to hit some of those numbers again, at a mere 10,000 homes sold a month from Zillow Offers, a 75% attach rate gets to over $800 million a year of revenue opportunity for mortgage origination.”

Three years and over 10,000 homes bought and sold later, the reality is a mortgage attach rate to Zillow Offers of less than 1 percent.


(Zillow and Opendoor's attach rate is based on the markets where the service is live.)

Zillow's goal of originating 3,000 loans per month, or 36,000 in a year, remains highly aspirational. Loan originations actually took a step backwards in 2019 before rebounding in 2020 due to the pandemic and record low interest rates -- but are still less than 20 percent of Zillow's original goal.


It's worth noting that proportionally, Zillow's purchase volume (versus refinance) has steadily declined from 97 percent in 2018 to 31 percent in 2020 (and down to 10 percent in Q1 2021). The growth in Zillow Home Loans is being fueled by refi.

The Rise of Power Buyers

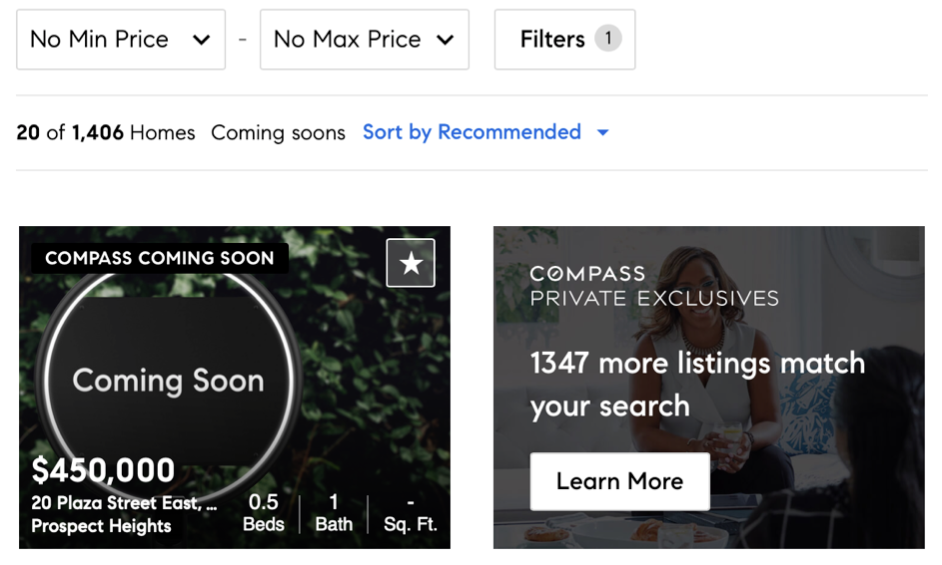
Ironically, Zillow is attaching more mortgages to Opendoor-owned homes than it is to Zillow-owned homes. Just let that sink in.

This bizarre fact underscores how difficult it is to attach mortgage to an iBuyer home for sale; most prospective buyers are already pre-approved. It's too late in the buyer journey to introduce and attach a new financing option.

Which is why the smart money is on companies -- I call them Power Buyers -- focused exclusively on attracting buyers earlier in the process with products like cash offer and buy before you sell. Examples include Homeward, Orchard, and Knock, and initiatives like Opendoor's Cash Offer and Zillow's video tease of it helping a Zillow Offers seller secure financing for their next purchase.

There are a multitude of companies attempting to sell mortgage and other adjacent services to their customers in an effort to increase profits. For the time being, the Power Buyers are in the lead with mortgage attach rates approaching 80%, with the iBuyers pivoting their models to catch up. Zillow's experience shows that it's a long, slow road, requiring big investment, patience, and a smart, consumer-first approach.

Compass Agents: You Are The Customer

As a newly public company, Compass faces a challenge to reach profitability. Its latest numbers reveal a noticeable drop in agent commission splits, a reminder that Compass’ path to profitability lies directly through -- and may come at the expense of -- its own agents.

Compass incurred losses of $212 million in its first quarter as a public company, compared to the $270 million it lost in all of 2020. Meanwhile, Compass’ peers managed to turn a profit during some of their best quarters ever.

 
Screen Shot 2021-05-17 at 12.12.46 PM.png
 

The $212 million loss includes a one-time expense of $149 million of stock based compensation. Looking at Adjusted EBITDA, where each company backs out various expenses to provide a more favorable accounting of the business, still reveals significant losses -- compared to the healthy profits at eXp and Realogy.

 
Screen Shot 2021-05-17 at 12.12.49 PM.png
 

The data reveals a brokerage continuing to lose money, especially compared to its peers, during a booming real estate market. But now that Compass is public, the spotlight is turning towards profitability and leading to an obvious source of additional profit: its agents.

The Agent is the Customer

In the first quarter of 2021, Compass’ agents generated $1.1 billion in revenue and were paid $900 million in commissions (including stock). But the effective agent commission split of 80.8 percent is a noticeable drop from the past year. While its brokerage peers paid proportionally more money to their agents, Compass paid less.


In its public filings, Compass attributes this “favorable decrease” (their words, not mine) to “the change in mix of the commission arrangements we have with our agents” and “changes in geographic mix.” The agent economics are changing in Compass' favor, and Compass is retaining more of the commission.

This dynamic is not unique to Compass, but it highlights the natural tension between brokerage and agent when less money being paid to agents is seen as “favorable” and “an improvement.”

For Compass, a reduction of its effective agent commission -- through a combination of changes in commission arrangements, geographic mix, and increasing technology fees -- of just 3 percent results in immediate profitability.

 
Screen Shot 2021-05-18 at 5.02.49 PM.png
 

It's highly unlikely that Compass will drop its agent commissions 3 percent and survive as a business. Agents would simply pack up and leave. But the gap isn't too far and, combined with rising technology fees, represents the fastest path to sustained profitability.

Compass' effective agent commission drop in Q1 2021 is the largest seen in two years. It may be an outlier or it may be the start of a trend, but it remains a key metric to watch going forward. And if you're a real estate agent, this is a gentle reminder to never forget that you are the customer.

A note on data: When calculating Compass' effective agent commission splits, I've included stock-based compensation. For Q1 2021, I've backed out the one-time acceleration of stock-based compensation expense of $41.7 million in connection with the IPO.

Zillow and realtor.com Battle for Traffic and Revenue Growth

According to the latest company results, it appears that Zillow's longstanding traffic lead over realtor.com is diminishing. In an industry where metrics like this move slowly if at all, it's fascinating. But it's also insignificant in terms of competitive advantage and revenue uplift -- and may simply be an artifact of pandemic browsing patterns -- but it does reveal a deeper truth around portal monetization.

 
image.png
 

Zillow's traffic advantage hasn't changed in years -- consistently hovering at three times the average monthly visitors compared to realtor.com. However, beginning in Q1 2020, that lead begins to erode.

 
Whatever it is, the way you tell your story online can make all the difference.
 

The timing suggests that this is likely a result of the pandemic. Perhaps Zillow has less upside, while realtor.com is benefiting from more consumers willing to visit multiple sites to see all available inventory in a high-demand, low-supply market.

A Corresponding Revenue Uplift

Across the board, the increase in portal traffic has resulted in an increase in revenues. Like Zillow, realtor.com experienced an unprecedented pandemic bump in lead gen revenues -- the first time in years.

 
image.png
 

But in this case, a rising tide lifts all boats. Both companies experienced a proportionally identical increase in lead gen revenue; Zillow's revenue lead remains unchanged at 2.5 times higher than realtor.com.

 
Whatever it is, the way you tell your story online can make all the difference.
 

The data above is an apples-to-apples comparison of each company's lead gen business: Zillow's premier agent vs. realtor.com's "real estate" revenues.

Strategic Implications


As I outlined in a recent analysis on challenger portals, there is a non-linear correlation between market share (traffic) and value (in this case, revenue). Time and again, it's "winner take most" for the #1 portal.

What I find fascinating is that despite all of the activity of the major portals, the monetization ratio has remained constant. Like the speed of light, there's an immutable law of portal monetization at play with an upper limit, unchanged despite:

  • realtor.com's $210 million acquisition of Opcity

  • A new CEO and senior management team at realtor.com

  • Zillow launching Zillow Flex and qualifying leads

And it's not just the U.S. In Australia, the top two portals have a similarly static monetization ratio despite years of intense investment and competition.

 
Whatever it is, the way you tell your story online can make all the difference.
 

At its extreme, this suggests a sort of monetization nihilism -- that nothing matters. Product improvements, senior management changes, business model shifts, global pandemics, and nine-figure acquisitions are, in the end, meaningless in terms of portals outperforming each other. There's a premium for being #1, and it just doesn't change.

What Zillow's Results Reveal About Its Momentum Towards Zillow 2.0

The coverage of Zillow's latest results is fantastically uninspiring. Lots of big numbers, devoid of context. But when the dots are connected they reveal a rich story about the business's evolution to Zillow 2.0.

Perhaps most impressively, Zillow just had its third consecutive profitable quarter! For a business that's basically operated at a net loss since inception, this is a noteworthy achievement.

 
Screen Shot 2021-05-06 at 10.03.27 AM.png
 

The move towards profitability is driven by Zillow's premier agent program -- the engine room of the company -- which is firing on all cylinders and back to impressive growth (fueled by record-breaking demand during the pandemic).


On an absolute revenue basis, Zillow's premier agent program has set a succession of all-time record quarters for the past 12 months. Zillow is generating more money from its premier agent program than ever before, which is especially noteworthy after the program ground to a halt in early 2019.

 
Screen Shot 2021-05-11 at 7.53.14 AM.png
 

Zillow's iBuyer business is back to growth mode, purchasing and selling houses at pre-pandemic levels, and still operating at a loss. But the net loss per home has dropped to its lowest level yet, a reflection of improving economics at scale.


Last week I looked at the Ecosystem Disruption in Mortgage, and how global leaders Zillow and REA Group have spent hundreds of millions of dollars expanding into mortgage through the acquisition of broker-heavy, 20 year old traditional businesses -- and not technology companies.

Zillow's mortgage business continues to grow, but it is being driven by refinancing (90%), and not new purchase (10%), business. To fully believe the one-stop-shop Zillow 2.0 narrative, new purchase volumes should grow in the future.


But while overall mortgage revenues increased, the business remains unprofitable. This is another sign that mortgage is hard, difficult to scale profitably, and tough to "reinvent" with technology. Like the Zillow Offers business, Zillow Mortgage appears to be another high revenue, low margin operation.

 
Screen Shot 2021-05-06 at 10.10.23 AM.png
 

The evidence reveals a business -- in my humble opinion -- that is still in the early innings of reinventing real estate. Zillow is clearly benefiting from the current red-hot real estate market, with its premier agent program leading the charge and funding the evolution to Zillow 2.0.

But the promise of new, adjacent services is still an aspirational goal. The various pieces are being built, but still need to be assembled in a credible way that reinvents the transaction at a meaningful scale. Momentum is on its side, and Zillow's evolution continues.

Portal Wars: CoStar vs. Zillow, Boomin vs. Rightmove

Across the globe, there are efforts underway to unseat leading real estate portals. In the U.S., commercial real estate behemoth CoStar has spent over $400 million to acquire residential listing portals Homes.com and Homesnap. And in the U.K., start-up Boomin is raising an additional £25 million to directly compete with Rightmove.

The primary value a real estate portal provides its customers is exposure to the most potential homebuyers and homesellers. In the U.S., Zillow's traffic lead over CoStar's recent acquisitions is astronomical.

 
Screen Shot 2021-04-29 at 6.29.34 PM.png
 

Homeowners want to advertise their biggest asset in the one place buyers will definitely look. Zillow is that place: From a traffic standpoint, Zillow has a reach 23 times larger than Homes.com, making it exponentially more effective and valuable.

Attempting to directly compete with market-leading real estate portals is an incredibly difficult proposition, with success unlikely. The unique challenges include:

  • Incremental gains in market share don't equate to incremental gains in value.

  • Getting listings is the easy part. Building traffic is hard.

  • Product differentiation means little. The main value to users is reach.

The CoStar Strategy

CoStar doesn't need to unseat Zillow to build a valuable business. Zillow's customers are real estate agents -- premier agents -- that pay Zillow for leads. However, Zillow only works with about five percent of real estate agents in the U.S., leaving a large addressable market for CoStar to tap into.

The narrative that CoStar is attempting to compete directly with Zillow is simply that: a story designed to rile up agents and generate buzz. The actual battle isn't about consumer eyeballs; it's about a real estate agent's wallet.

Strategic Implications

The challenger portals are succeeding with the easy bit: securing listings. Traffic is the hard part.

Through the years, the top portals have maintained their lead against billion-dollar, multinational media organizations (Zillow vs. realtor.com, IS24 vs. Immoweb), industry-backed, publicly listed upstarts (OnTheMarket vs. Rightmove), private-equity backed #2's (Zoopla vs. Rightmove), and publicly listed competitors (Domain vs. REA Group). Hundreds of millions of dollars have been thrown against the top portals for years with no effect on their dominant position whatsoever.

Past evidence shows that it is exceedingly unlikely that this new batch of challengers will dethrone the top portals. The smart challengers understand this game and how it’s played; not trying to overtake the leaders, but instead building a viable business on its own merits.

A Deeper Dive

Check out the articles below to dive deeper into the massive advantages that incumbent portals possess and the challenges around trying to disrupt them.

Ecosystem Disruption in Mortgage Looking Exceedingly Traditional

Last month, Australia's #1 real estate portal, REA Group, announced the $244M acquisition of mortgage broking business Mortgage Choice. This is the latest move by global leaders Zillow and REA Group to spend hundreds of millions of dollars expanding into mortgage through the acquisition of broker-heavy, 20 year old traditional mortgage businesses -- and not technology companies.

 
image.png
 

Real estate portals are moving closer to the transaction, and there is a battle brewing in adjacent services. For portals, it's a path towards revenue growth and a seamless customer experience. For new models like iBuying, it's the only path to profitability.

But: mortgage is hard. The underlying economics demonstrate how difficult it is for portals to grow these businesses. Financial services is still a small segment of REA Group's entire business, representing less than three percent of total revenue. It is, however, profitable, with margins just under 40 percent. But overall revenue growth has stalled and moved backwards since the acquisition of Smartline.

 
image.png
 

By comparison, Zillow's mortgages segment (which includes Mortech and its mortgage lead gen business, in addition to the Mortgage Lenders of America broking business), has seen strong revenue growth but is much, much less profitable.

 
image.png
 

Zillow acquired Mortgage Lenders of America (MLOA) in June 2018, which was followed by a modest revenue uplift. However, it appears the driver of FY20 growth was the pandemic and record low mortgage rates in the U.S.

 
image.png
 

Zillow's mortgage business was unprofitable leading up to the MLOA acquisition, and subsequently became much more unprofitable. It wasn't until the massive growth during the pandemic that the segment eked out a profit.

 
image.png
 

The evidence suggests an underlying business that is expensive to run and difficult to make profitable. Getting adjacent services right and running a successful mortgage broking business -- and in REA Group's case, growing it -- is hard work.

For all the money being invested in this space and the hype around a digital ecosystem, it's noteworthy that the real estate portals see their path to growth via traditional brick-and-mortar brokerage businesses, and not high-flying, scalable tech solutions. Mortgage is not an industry that can be disrupted with technology alone.

iBuyer Purchases Recover to Pre-Pandemic Levels

The pandemic of 2020 brought iBuying to a grinding and dramatic halt. The major iBuyers -- Zillow, Opendoor, and Offerpad -- have slowly recovered, with total purchases in Q1 2021 finally rising to the levels of the same period last year.


A few additional observations on the above data:

  • While Opendoor has matched its year-over-year purchase volumes, Q1 2020 was itself an outlier, with significant slowdown in purchases from Q4 2019.

  • On average, Opendoor is still 35 percent below its high-flying 2019 peak.

  • Offerpad, soon to go public via a SPAC, is a respectable third player, with purchase volumes of about half of the leaders.

Before the pandemic, Opendoor was the clear category leader, purchasing over twice as many houses per month as Zillow. The lockdown was the great equalizer; both companies dropped to near zero, and recovered at the same pace throughout 2020. However, in the first quarter of 2021, Opendoor again pulled ahead while Zillow took its foot off the accelerator.


From a sales perspective, all iBuyers are still well-below their pre-pandemic highs. Opendoor sold 55 percent fewer houses in Q1 2021 than the same period a year ago. This is attributable to timing; as the iBuyers purchase more houses and rebuild their inventories, sales will follow.

 
Screen Shot 2021-04-20 at 9.38.16 AM.png
 

Individually, the top six iBuyer markets are mirroring the gradual recovery. Phoenix and Atlanta remain the largest markets by volume by a wide margin.

 
Screen Shot 2021-04-20 at 9.37.54 AM.png
 

The iBuyers are down but not out. Recovery continues at pace; the business model is certainly here to stay, but not without its recovery challenges.

The Compass Valuation Quandary

Compass' recent debut as a public company was a mixed bag. Of considerable note is the current valuation: $6.65 billion, compared to $6.4 billion when it last raised capital two years ago. The tiny gain brings up interesting questions: Why has Compass' valuation not increased more, and how does it compare to its peers?

 
Screen Shot 2021-04-08 at 7.43.57 PM.png
 

Compass has a massive valuation, on par with Redfin and dwarfing Realogy. This analysis isn't about the valuation itself, but rather changes in value over time. Often, trends and momentum reveal more than absolute figures.

Between July 2019 and April 2021, many real estate and real estate tech stocks have seen massive gains, even traditional incumbents like Realogy and RE/MAX. However, Compass stands out with a tiny 4 percent gain in valuation over the past two years -- two years which has seen massive growth at the company across all metrics.

Compass has positioned itself on the cutting edge of real estate tech, promising to revolutionize the industry through unprecedented investments in technology. However, the company valuation has hardly budged in two years. Why the disparity?

The valuation discrepancy -- especially compared to its peers -- stands out loud and clear. Investors either significantly over-valued the company in its previous fundraising rounds, or are pessimistic about its growth prospects going forward.

Research note: Company valuations from July 2019 are taken from GCA Advisors research, and for 2021 are from April 8th. All valuations are a like-for-like "equity value." Opendoor's 2019 valuation is from March, the remainder from July 2019.

America's Next Top Real Estate Model: Tracking the Growth of eXp, Redfin, and Compass

Compass, eXp Realty, and Redfin are three of the largest, fastest-growing brokerages in the U.S. Each operates a traditional brokerage business model and leverages technology as a key competitive differentiator. A deeper look at the rapid rise of each reveals a trio of insightful growth stories — which may very well shape the future of America’s real estate landscape.

 
ezgif-3-e37322da240f.gif
 

The changes to the top 20 U.S. brokerages by transaction count are striking (data courtesy the Real Trends 500). In 2018, the top two brokerages (Realogy and Berkshire Hathaway HomeServices) dwarf the competition; no other brokerage comes close. Fast forward to 2020, and eXp Realty is within striking distance of the top two, followed closely by Compass.

Each business has experienced wildly different growth trajectories. Compare Redfin’s slow and steady growth to the exponential hockey stick curves of Compass and, most impressively, eXp Realty.

 
Screen Shot 2021-04-06 at 8.11.09 PM.png
 

The engine room of each company’s growth is driven by agents (as I like to say, agents sell houses, not technology). The corresponding agent count at each company closely mirrors overall transaction count growth. Redfin has far, far fewer agents than its peers, but its agents are exponentially more efficient.

 
Screen Shot 2021-03-31 at 9.29.41 AM.png
 

Since 2018, Compass and eXp have grown agent count and transaction volume exponentially, which -- at this scale -- is unheard of, and why each company is so disruptive in the industry.

 
Screen Shot 2021-03-31 at 9.29.54 AM.png
 

Reviewing the interesting similarities and key differences between the three companies reveals their different target markets, represented by average sales price. Compass is clearly in the luxury band, while Redfin caters to high priced homes and eXp is closer to the national average home value.

 
Screen Shot 2021-03-31 at 10.04.39 AM.png
 

In the end, Compass and eXp are quite similar: fast-growing real estate brokerages fueled by unprecedented agent growth. Both companies leverage cash (or the promise of cash via stock options and/or multi-level marketing) to recruit, and lean on technology as a differentiator.

In 2018, it could have been possible to ignore the companies or dismiss their efforts to grow. But in 2021 they've become too big to ignore, and are cementing -- and growing -- their leadership position in the future of real estate.

 
Screen Shot 2021-03-31 at 5.42.19 PM.png
 

CAC-attack: The Cost of iBuyer Customer Acquisition

Over the past three years, the largest iBuyers -- Opendoor, Zillow, and Offerpad -- have spent over $200 million advertising directly to consumers. That spend peaked in 2019 before slowing during the pandemic. Historically and today, Opendoor appears to be vastly outspending its competition -- a reflection of its size, scale, and ambition.

 
image.png
 

Historically, Opendoor has bought and sold more houses than its iBuyer peers, so it's important to consider the advertising expense per customer, or customer acquisition cost (CAC). Last year appears to be an expensive outlier for Opendoor.

 
image.png
 

Generally, it's what you would expect: between $3k–$4k in a normal year. Given that each iBuyer pays a 1 percent referral fee to agents for a closed lead (or $2,500 on a $250k home), the numbers make sense. It's also a blended average, so mature markets are likely less expensive while new markets are more expensive.

A broad comparison, which includes newly-released data from Offerpad (with a CAC of about $3k), and advertising expenses from Redfin's brokerage business, provides further context around the iBuyer spend.

 
image.png
 

Some interesting observations:

  • Customer acquisition costs for the majors iBuyers is all roughly the same: between $3k–$4k (if we consider 2020 an outlier for Opendoor).

  • Zillow, with its massive audience advantage, has to spend much less on advertising, and has a meaningful CAC advantage.

  • Compared to Redfin's brokerage service (which also has the advantage of an existing portal with millions of visitors), the iBuyers are spending 2x–4x more to acquire each customer. This is not an exact corollary, but is reflective of how difficult it is to convince consumers to try something new.

Shifting Headcount

The Sales & Marketing line for each iBuyer includes headcount expenses for employees involved in the sale of homes, a fairly broad definition. And there was a noteworthy shift in headcount during 2020.

Opendoor laid off staff and saw a "decrease of $26.7 million due to headcount reductions," while Zillow saw an "increase of $21.8 million in headcount-related expenses." Opendoor was trimming its sails while Zillow continued to invest for a future recovery; the advantage of being well-capitalized during 2020.

 
image.png
 

A Note on Methodology

Customer acquisition cost is calculated based on the total advertising spend divided by the number of homes purchased in a period of time. Direct advertising and headcount expenses are taken from each company's public filings, which is straightforward if you know where to look and are willing to do a lot of math.

The Economics of iBuying, 2020 Edition

With 2020 firmly behind us, the world's two largest iBuyers have released their full financial results for the year. Last week, we looked at their total financial losses. And today: A direct financial comparison of Zillow vs. Opendoor, and an individual look at the key points of difference from 2019.

An Overall Financial Picture

A comparison between Zillow and Opendoor highlights the tightening race between the two billion-dollar behemoths. In terms of revenue (which includes the full value of a home), Opendoor has managed to maintain a 50 percent lead over Zillow. But that lead is down from a whopping 250 percent in 2019.

 
68cc80fd-f6ef-46d2-8f45-98d2d71951d7.png
 

Opendoor's 2020 experience was fluid. It managed to improve the efficiency of its business model, as measured by gross margin (driven by home appreciation and ancillary services), while reducing operational costs. This improved its contribution margin, but with robust overhead expenses, its net margin further deteriorated.

 
5bfefabe-5012-4b33-a217-a04cf477ee35.png
 

Zillow continued to grow its iBuyer business in 2020. It saw an increase in revenue and improved gross margins, with relatively static operational costs. It managed to reduce its overall net loss compared to last year.

 
42327a10-fc36-4e8a-b074-270a856f3b41.png
 

The differences between Opendoor and Zillow, from a financial and unit economics perspective, are evident in the numbers:

  • Opendoor is better able to monetize the transaction (higher gross margins).

  • Zillow's Selling Costs are higher (due to the use of partner agents, an activity being phased out in 2021).

  • Opendoor is eking out small efficiency gains in Holding Costs and Interest Expense, an advantage that accumulates at scale.

Or, in other words: Opendoor is more operationally efficient, Zillow is catching up, and both companies remain unprofitable.

Unit Economics

The following charts, which are to the same scale, illustrate the economics above in a more attractive visual fashion. Amongst other things, they highlight how large indirect expenses are in both businesses.

 
Screen Shot 2021-03-12 at 9.08.35 AM.png
 
 
Screen Shot 2021-03-12 at 9.08.37 AM.png
 

While not necessarily hidden, neither company is guilty of highlighting its overall net losses nor the unprofitable nature of the business (a topic I discussed in iBuyers Turning Obfuscation of Profit into an Art Form). There are various forms of financial misdirection at play that highlight unit economics, Adjusted EBITDA, or other metrics that don't convey a complete picture of the business.

The point is not that these business are unprofitable and therefore must be bad. Spending (and losing) money to gain market share is a well-worn path. The point is that these companies are actively doing it, and if you're in the real estate industry, concerning yourself with disruptors willing to lose billions is a good use of time.

Massive iBuyer Financial Losses Continue

The “Reinvention of Real Estate” comes with a staggering price tag. In 2020, the two largest iBuyers, Opendoor and Zillow, lost a total of $607 million buying and selling houses. That’s a loss of about $40,000 on each home bought and resold, about $1.6 million every single day, or about $1,100 per minute in 2020.

 
Screen Shot 2021-03-08 at 10.33.53 AM.png
 

And that $607 million is on top of the $650 million lost in 2019 — well over $1.2 billion in the past two years.

Opendoor's Challenging 2020

Opendoor accumulated losses at a quickening pace during a challenging 2020. Like Zillow, it stopped buying houses earlier in the year, and its recovery since has been slow. This has corresponded to a striking decline in the number of homes sold throughout the year, especially compared to last year.

 
Screen Shot 2021-03-09 at 2.37.34 PM.png
 

As expected, Opendoor’s decision to pause listing new homes for sale in late 2020 led to a dramatic drop in home sales in Q4 2020. Without a corresponding drop in corporate overhead expenses, Opendoor’s financial metrics reached a new milestone: a net loss of over $100k per home.

 
Screen Shot 2021-03-09 at 2.38.53 PM.png
 

But it's almost certainly a temporary setback. On the plus side for Opendoor, and as a result of building up inventory in late 2020, it's going to have a blowout Q1 2021.

A Revealing Fourth Quarter

The key financial drivers for each iBuyer were quite different in the last quarter of 2020. Opendoor managed to blow Zillow away with a gross margin of 15.4 percent — which is a combination of service fees, price appreciation, renovation expenses, and ancillary revenue streams. Opendoor was better able to monetize the transaction.

 
Screen Shot 2021-03-09 at 2.37.48 PM.png
 

The subsequent cost drivers show an equally revealing story. Especially Opendoor’s record-low selling costs of 2.1 percent. The bulk of this fee is brokerage commissions. The drop from 3 percent earlier in the year is notable, and is likely the result of Opendoor continuing to push down the buyer agent commissions offered on its houses.

Holding costs and interest expense are also lower — by about half — from earlier in the year, and both iBuyers appear evenly matched (aside from a slight interest expense advantage to Opendoor).

Good for Consumers

Despite their staggering financial losses, the evidence suggests that Zillow and Opendoor remain staunchly pro-consumer. Both businesses are determined to pass a financial benefit on to consumers alongside a streamlined experience:

  • Opendoor lowering its service fee for homeowners, now down to 5 percent.

  • Zillow Rewards offers savings when consumers bundle its services together.

  • Opendoor offering savings when using its in-house services.

  • Both iBuyers paying very close to fair market value.

Contrast this with another real estate tech disruptor, Compass, which is self-admittedly obsessed with agents (and not consumers). The difference shows. Compass’ strategy of gaining market share and promoting exclusive listings available only on its platform is good for business, but not for consumers.

Beginning to Unpack the Compass IPO in Four Charts

At long last, Compass' IPO filings have revealed the financials and other key metrics of the business. This Friday I'll be hosting a paid webinar to fully unpack the filing, along with examining key strategic questions and implications for the business. To start, here's a few key takeaways presented around four charts.

Financials

Compass is unprofitable -- a net loss of $270 million in 2020 -- a result of its operating expenses exceeding its gross profit (revenue after paying out agent commissions). Losses were growing into 2019, and contracted in 2020.

 
72c3976d-e59d-459e-be56-863e3ae10f11.png
 

Historically there's been a wide gap between these figures, resulting in massive unprofitability. Last year was an outlier due to Covid-19; Compass saw a surge in revenue during Q3 and Q4, while its expense growth dropped significantly (partially driven by a reduction of headcount, operations & support, and sales & marketing).

Annual Growth and Efficiency

Between 2019 and 2020, Compass did 66 percent more transactions with 48 percent more agents (note: I'm using a midpoint total agent calculation, instead of the smaller Principal Agent figure provided by Compass). The result is an improvement in efficiency: on average, each agent did 12 percent more transactions.

 
6e40b6db-1daf-459d-a6da-f0d7b4237e58.png
 

Context: the market was crazy hot in 2020; many agents were doing more transactions. The market as a whole was up 5.6 percent for the year, and December alone was up 22 percent compared to last year. At the end of the day, 12 percent is an incremental improvement, and much of it could be driven by the hot market.

The real key is that the number of Compass employees was only up 29 percent. In other words, Compass was able to support 48 percent more agents and 66 percent more transactions with only 29 percent more employees. That's a promising sign of improving operational efficiency.

Improving Operational Efficiency

Another sign of improving operational efficiency is Compass' total Operations and Support expense ($225 million in 2020) relative to the number of agents and transactions the business supports. Over the past three years, it's gone down, a sign of improving efficiency.

 
5b27a16c-a49d-4c49-8d48-5a21d41a0bb1.png
 

Gross Margins

When all is said and done, the Compass financials are bleak if you care about profitability. One of the biggest challenges is Compass' gross margins -- which are total revenues minus agent commissions and other transaction-related expenses. It's the "net revenue" a business makes before all of its indirect expenses are taken into consideration.

 
a7c8c5f6-a996-4908-a9b8-a5610344d877.png
 

Compass' gross margins are low (and have been dropping over the past few years). Its gross margin is on-par with traditional brokerage peers in the industry -- and, interestingly, are the same as aircraft manufacturer Boeing. These are not the 70%+ gross margins of a technology company.

Compass is losing less money per transaction as it scales, but it's still losing a lot of money. The path to profitability, which I'll cover in my webinar, is uncertain. The fundamentals of the Compass business model, anchored by its low, brokerage-style gross margins, coupled with sky-high expenses, paint a particularly interesting challenge for the business -- and the industry -- going forward.

Strategic Analysis: The Top Threat to Real Estate Portals

Real estate portals occupy a dominant position across the industry. Jealous of that power, potential competitors have long tried to challenge the status quo, with limited effect. But now a new threat emerges that, while still a long shot, possesses the greatest potential to disrupt the dominant position of the portals.

The Competitive Strength of Portals

Real estate portals benefit tremendously from network effects, which is the key factor that gives them unprecedented market power and an impregnable moat to repel competition.

Network effects is the phenomenon whereby a service becomes more valuable when more people use it. Online marketplaces and social networks such as Facebook, eBay, and Craigslist are classic examples of businesses with network effects.

Businesses that have the benefit of network effects are incredibly difficult to displace. Even if a new entrant’s product is objectively better, a smaller audience of potential buyers and sellers results in an inferior consumer proposition. Sellers want to advertise to the biggest audience possible, and buyers want the largest selection possible.

Real estate portals like REA Group in Australia and Zillow in the U.S. have a dominant competitive position because they have millions more buyers than any other platform. This key attribute, enabled by network effects, results in leading portals easily maintaining their leadership position against well-funded competition.

The Rise of Exclusive Content

In the past, various competitors have tried a variety of strategies to displace the dominant portals: product differentiation, massive media spend, brokerage alliances, and more. But time and again these strategies have failed.

There is one significant risk -- an achilles heel -- to portals: they don’t control their inventory. Disintermediating the flow of listings to the big portals, through exclusive content, is their greatest threat.

To illustrate this concept, look no further than video streaming services. Netflix, Disney+, Amazon, and AppleTV are investing billions into creating exclusive content. And this content -- available on only one streaming platform -- is the key differentiator that draws consumers to the service.

image.png

When it comes to browsing for real estate, consumers want access to all of the available inventory. If a certain portion of listings are held off-market, available exclusively on another platform, consumer eyeballs will naturally follow.

More than any other strategy, exclusive content has the potential to draw consumer eyeballs away from the dominant portals. But ultimately, while the move is pro-disruptor and anti-portal, it is also potentially anti-consumer, putting the benefits of a company ahead of consumers.

Industry Fragmentation and Consumers

For consumers, exclusive content creates a fragmentation of the search and discovery process. It forces buyers to visit more than one site, with no direct benefits. For sellers, it fragments and artificially reduces the number of possible buyers.

The only beneficiary is the portal disruptor -- the organization creating and promoting the exclusive content. By bringing more consumers directly to their web site, it creates a realignment of power from the portals to the disruptor.

What real estate portals brought to the market was transparency: easy access to all available listings. In the U.S., they democratized the search process by eliminating the information asymmetry between consumers and real estate agents. Fragmenting inventory across multiple platforms is a step backwards into the dark ages of real estate, where consumers no longer have easy access to all available listings.

Case Studies

The following case studies illustrate examples of exclusive content being leveraged to break the monopoly powers of portals. And some portals are fighting back, directly and indirectly, by promoting themselves as the most effective place to advertise a home for sale.

There are three case studies of real estate portal challengers attempting to disrupt the top portal: two large brokerages, and one challenger portal. The analysis concludes with a case study of what one top portal is doing to push back against exclusive content.

Case Study: The Challenger Portal

OnTheMarket is an upstart, industry-backed portal meant to challenge the dominance of Rightmove and Zoopla in the U.K. It launched in 2015 and has faced a slow, uphill battle to achieve relevance.

One of the legs of its strategy is around exclusive listings: “thousands of new properties a month, 24 hours or more before they are advertised on Rightmove or Zoopla.” According to OnTheMarket, this amounts to between 2,500 and 10,000 properties each month.

 
image.png
 

The strategy is credited with increasing the portal’s traffic, but after years its traffic is still a fraction of the dominant portals in the market. It has helped the challenger portal grow and build relevancy in the market, but has done nothing to dent the dominance of Rightmove.

Case Study: The Traditional Brokerage

Howard Hanna is the fourth largest brokerage in the U.S., with over 100,000 transactions closed in 2019. In June of 2019, it launched the Find It First program, where new listings are available only on the company’s web site, HowardHanna.com, for a set time before being published on the multiple listing service.

 
image.png
 

The service launched in an effort to increase traffic to the company’s own web site by leveraging exclusive content not available anywhere else; a fact highlighted by the company.

 
image.png
 

The benefit to potential home buyers is clear: register on HowardHanna.com to receive updates on exclusive content before they are posted anywhere else. The benefit to sellers is less clear. As the company says, “...it creates an urgency for their property to be offered first to highly motivated buyers, who are most likely to bring an offer.” But the pool of buyers is a fraction of the entire market: 2.1 million visits in July 2019 compared to over 700 million visits on Zillow.

Howard Hanna’s program offers another benefit for sellers, which is less about exclusive content and more a ding at Zillow’s business model: prospective buyers should be connected directly with the listing agent, who knows more about the property than anyone else. The benefit to consumers finding a property on HowardHanna.com first is that a connection to the listing agent can be made directly, without any intermediaries.

But the program is small. In September 2020 there were less than two dozen listings across the Northeast and Midwest. In February 2021, with over 20,000 listings in the Northeast, only 13 Find it First properties were found.

Case Study: The Tech-Enabled Brokerage

Compass is the fifth-largest brokerage in the U.S., with over 80,000 transactions closed in 2019. As mentioned in my 2019 strategic analysis of the business, Compass has an active history of promoting exclusive listings, either coming soon or private exclusives.

What sets Compass’ exclusive content strategy apart from others is its traction and promotion. Compass is not shy about promoting exclusive listings on the compass.com web site: it’s featured on the header and is highlighted immediately below the search bar.

 
image.png
 

All search results pages highlight private exclusive listings, which are only available to home buyers that contact a Compass agent. The fact that there are more listings that can be shown is dangled in front of consumers in a very prominent way.

 
image.png
 

Clicking through for more information on private exclusives makes it clear that to see more, you need a Compass agent. The additional listings are not available on “home search websites.”

 
image.png
 

The concept of a private exclusive listing is not new; what’s new is the degree of in-your-face marketing applied to the program by Compass. In comparison, consider Sotheby’s International Realty, which has no mention of nor listings of private exclusives or coming soons. Sotheby’s is not leveraging the power of exclusive content, while Compass is -- in a big, aggressive way.

That fact is sprinkled throughout the Compass web site, subtly and overtly. On the search results filter page, visitors are reminded that a large amount of listings are “only on Compass.”

 
image.png
 

The value proposition for home buyers (which, by the way, are how the U.S. real estate portals monetize their traffic) is quite clear: exclusive content not available anywhere else.

The value proposition of a coming soon listing for home sellers is less specific: increase exposure, generate buzz, and deliver market insights. Again, all to a smaller audience than what the national real estate portals deliver.

With regards to the seriousness of Compass’ program, the numbers paint a clear picture. According to compass.com, in September of 2020 Compass had over 17,000 listings nationally -- with over 2,800 as exclusive content (either Coming Soon or Private Exclusive). These 2,800 listings (16 percent of Compass’ total inventory) were only available on compass.com or via a Compass agent; none were on Zillow.

 
image.png
 

And the percentage of listings exclusively on compass.com is increasing. As of February 2021 there were around 12,000 Compass listings nationally, with 2,800 “only on Compass” -- or 23 percent. Nearly a quarter of Compass’ listings are exclusive content. In one of Compass’ biggest markets, San Francisco, 504 out of 913 total listings were exclusively on Compass, a massive 55 percent.

The concept is perhaps best illustrated in Compass’ own words, through this LinkedIn post by a Compass agent. Note the key phrase: “I have inventory on our platform that will never get listed on Zillow or Redfin. Get a Compass agent...or miss out.”


Case Study: The Incumbent Real Estate Portal

REA Group operates the dominant Australian portal, realestate.com.au, which also happens to be the world’s most profitable real estate portal. The team at REA understands the value of network effects, and has built marketing campaigns around having “Millions More Buyers” than the competition.

REA faces a challenge in the Australian market: property owners that wish to sell their homes “off market.” Similar to Compass’ exclusive listings, these properties never get advertised on a national property portal, and reach an audience through existing networks and word of mouth.

REA has met this challenge -- and the associated risk to its market-leading position -- head on with a series of direct-to-consumer TV advertisements.


The rhetorical message to consumers is clear: why would you not advertise your biggest asset in the one place buyers will definitely look?

Power Moves

The move towards exclusive content is about power. The organizations affecting this change are companies looking to grow revenues and maximize profits. The benefits of a potential shift in consumer eyeballs will accrue to these for-profit companies, at the expense of real estate agents and consumers.

There may be a short-term benefit for real estate agents, by reducing their reliance on a national portal, but that reliance just shifts to a different company. And it is that company, and no one else, that becomes the distributor of consumer eyeballs and leads to agents. The power remains with a company, and not with an agent.

Ultimately, the consumer may be the biggest loser. The creation of new advertising channels, especially in markets outside of the U.S., means that homeowners will need to pay an additional fee to advertise on those new channels. And, in the words of Compass, if listings “never get listed on Zillow or Redfin,” millions of potential buyers may never see them, which could lead to less demand and a lower price for a property, a cost paid for by homeowners.

Generating and publishing exclusive content appears to be one of the most effective possible strategies against the portals’ dominance. It is a relatively new, active battleground in the evolving war for the future of real estate. But as these billion dollar behemoths battle for supremacy of the real estate industry, with agents as their unwitting pawns, consumers may be left paying the price.

Opendoor Withholds Listings From the Market

In late 2020, while Opendoor continued to purchase hundreds of homes each week, it stopped listing new homes for sale. This unusual behavior lasted four weeks, and reveals an interesting consequence of the rise of new models in real estate, specifically iBuyers.

Between November 10th and December 10th, Opendoor listed no new homes for sale in any market, nationally (Opendoor also did not list homes during the week of Christmas). For comparison, during the same period Zillow continued purchasing and listing new homes for sale.

 
image.png
 

During this time, Opendoor continued to purchase homes from consumers. Its purchase levels in November and December -- while still well below the levels of 2019 -- remained robust, with no visible slowdown.

 
image.png
 

The result of Opendoor's action -- during the run up to its IPO -- created an artificial buildup of inventory. It was a concerted, company-wide effort -- but what was the purpose?

Understanding Why

Here's a hypothesis: An iBuyer books revenue when a home is sold. By withholding listings for a month, Opendoor pushed back the likely period when those houses would sell (and it would book revenue) into 2021 -- to its first full quarter as a publicly listed company.

Regardless of the specific reason for the action -- pumping up revenue numbers, maximizing home appreciation, or simply taking a break before the holidays -- a decision was made, and the results are the same: Opendoor's inventory of houses increased by withholding new listings from the market.

Implications for Consumers

While a relatively small move that kept 300⁠–400 houses off the market for an additional month, Opendoor's action is an example of what happens when home purchasing power aggregates to one company. (A previous example is Opendoor and Zillow's systematic move to reduce buyer agent commissions.)

What happens when a company -- backed by Wall Street and motivated by profit -- has the ability to withhold listings from the market in the midst of a once-in-a-generation housing shortage? With the rise of new models that change the paradigm of home ownership, careful attention should be paid to a possible collision between what's good for a company, and what's good for the consumer.

iBuyers Turning Obfuscation of Profit into an Art Form

A casual investor could be excused for confusing iBuying with a profitable business. Zillow's latest shareholder letter claims, "Average return on homes sold before interest expense was a gain of $21,830 per home," while Opendoor's investor presentation highlights "positive unit economics" with a contribution margin of $11k/home.

 
image.png
 

Both statements are factually correct. However, the figures provided are cloaked in asterisks and notes. Opendoor and Zillow are emphasizing unit economics of iBuying that exclude tens of millions of dollars of expenses -- ranging from salaries to marketing to technology -- that are necessary to operate the business.

It's the equivalent of an immaculate conception version of iBuying, where transactions magically occur without employees, customers materialize out of thin air, and technology is freely available for all.

When all indirect costs are included, profitability quickly drops into the negative for both companies.

 
image.png
 

Zillow's average return on homes sold before interest expense​ is a gain of around $22k per home, but after all expenses are included, the net loss per home is $72k. Tracking this number shows the true unprofitability of the business over time.

 
image.png
 

Both companies are unprofitable, losing roughly $300 million each in 2020. When all expenses are included, each company is losing tens of thousands of dollars per home. Opendoor is losing less money per home than Zillow, in both 2019 and the first nine months of 2020.

 
image.png
 

The profitability measure each company highlights is Adjusted EBITDA, which presents its own challenges. The "I" in EBITDA stands for "interest," which means that Zillow and Opendoor are excluding their collective interest expense from the calculation. Interest expense is a large and necessary component of the iBuyer business model, and amounts to tens of millions of dollars each year.

 
image.png
 

In 2019, Opendoor's interest expense was $105 million, which is not included in its only visual profitability measure. To find the true net loss (over $300 million), readers need to scroll to the very last slide in Opendoor's investor deck, in the appendix.

Turn On The Lights

One of Zillow's corporate values is to "Turn On The Lights." To quote: "We believe that information is power, and we’ve made it our business to increase transparency in real estate and within our company. Our purpose is to unlock information and empower our people, customers and partners to make better decisions."

I agree: information is power, and transparency is powerful. It leads to better decision making. Much of my work is aligned to the necessity of transparency.

iBuying is a new business model fueled by billions of investment dollars. The first question on many people's minds is, "Is it profitable?" Not when necessary expenses are excluded, but the entire business model.

My request is simple: talk about profitability. Don't shy away from it. Don't make readers flip to the appendix or supplementary financial tables and do a series of calculations to get their answer. Turn the lights on.

iBuyer Market Share Set to Drop By Half in 2020

From a transaction volume standpoint, the pandemic of 2020 was not kind to iBuyers. Overall volumes and market share are set to drop by 50 percent compared to 2019, a reflection of the iBuyer business model coming to a complete standstill followed by a slow recovery.


This drop stands in sharp contrast to the overall U.S. housing market, which is on fire. Overall transaction volumes are running well above last year's levels.

All of the major iBuyers saw a significant drop in 2020 compared to 2019, but Opendoor stands out for several reasons. First, it remains the largest iBuyer, with around 2x the transactions of its closest competitors. But it also saw the biggest year on year drop in volumes: down about 60 percent from 2019.


This is a reflection of both Opendoor's high-flying activity in 2019, and its painfully slow post-lockdown recovery. Opendoor's purchases are still down over 70 percent from the same time last year. Recovery is slow; much slower than the overall market.


Segment market share continues to shift among the big four iBuyers. Opendoor's share of the market is down to 50 percent -- a gradual decline from 2018 as new players entered the market and the overall segment grew rapidly. Zillow has made a strong entrance while Offerpad has maintained its position.


The pandemic of 2020 affected real estate in a variety of unprecedented ways. The drop in iBuyer market share and transaction volumes isn't a failure of the model, but it is a result of the model. The iBuyers face a slow climb back to the levels of 2019, as they conservatively ramp up operations in a new, uncertain housing market.

The Economics of iBuying

Sometimes it's easy to forget how much money iBuyers are losing. Investor presentations focus on positive unit economics, which don't include non-trivial expenses such as employee salaries, customer acquisition, technology development, office rent, and more. Neglecting these expenses -- which account for hundreds of millions of dollars per year -- paints an incomplete picture of iBuyer economics.

 
e04e186d-0d1a-4622-9c03-d2bd8d9d88cb.png
 

In the case of Opendoor, that's an additional $366 million -- or nearly $20,000 per home sold -- of expenses in the "Everything Else" category. Contribution margin is a perfectly legitimate metric, but it doesn't tell a complete story of profitability.

From Profit to Loss

A key measure of the iBuyer business model is gross profit, which is driven by service fees, purchase price, sale price, ancillary services (like title insurance and mortgage), and any necessary repairs. The metric focuses on the physical asset itself, and doesn't include costs associated with the process of selling the home.

In the first half of 2020, Zillow and Opendoor managed to generate around $17,000 in gross profit for each home bought and resold.

 
78dee919-5487-4657-9973-08b7ae2f454c.png
 

Zillow is catching up to Opendoor. If gross profit is a reflection of accurate pricing algorithms, competitive fees, and attaching adjacent services, the evidence suggests that operational efficiency is not the exclusive domain of Opendoor.

After gross profit, the largest direct expenses are selling costs (primarily composed of commissions paid to agents), holding costs, and interest expense. The data reveals that Opendoor has lower costs across all three categories.

 
084be129-42e8-4c0e-9ee5-d1bf3ebd9611.png
 

Opendoor's lead in holding costs and interest expense are marginal. Zillow's recent announcement that it was hiring its own internal agents -- and will no longer be working with (and paying) premier agent partners on the homes it sells -- will reduce its selling costs to be closer in line with Opendoor.

Last come the indirect costs (employee salaries, marketing, office space, etc) -- perhaps indirectly linked to selling a home from an accounting perspective, but still critical to operating an iBuyer business. Zillow Offer's financials highlight how significant these costs ($266 million) are in an overall picture of profitability.

 
c526c8da-fe5e-4d3e-8d0d-80888d793646.png
 

Once all expenses are included, the economics are complete: each iBuyer is losing tens of thousands of dollars on each home it buys and resells.

 
fcfd7d1f-dc73-4946-819c-75f0c1a04683.png
 

The overall economics are improving; between 2019 and the first half of 2020, each iBuyer lost less money on each home. But the totals are still negative, and when buying thousands of homes, total losses add up quickly: in the first half of 2020, Opendoor lost over $118 million and Zillow over $178 million.

Red is the New Black

At the end of the day, does it really matter? The information above is no secret; it's readily available in the public disclosures and filings from both companies. But it does take a rainy afternoon to find, compute, and digest the meaning of it all.

The public-facing presentations and shareholder letters focus on a single piece of the equation: unit economics, or contribution margin. An equally easy to digest explanation of the full economic picture is not always present.

The iBuyers are playing by a different set of rules where profitability doesn't apply. It doesn't matter that iBuyers are unprofitable; to-date, shareholders don't mind, and are happy to subsidize massive losses. Disruption in real estate is being led by companies -- and shareholders -- willing to bet and lose billions of dollars.

The iBuyer War on Real Estate Commissions

For years, the traditional real estate commission structure in the U.S. has remained relatively impervious to change. Buyer agent commissions -- the fee paid to a buyer agent when a house is sold -- is the focus of multiple class action lawsuits. But it turns out that the biggest threat to the traditional structure may be iBuyers, which have been waging a silent, systematic war on buyer agent commissions.

This research study looks at buyer agent commissions offered by iBuyers: 11,500 transactions over two years across four of the largest iBuyer markets (Phoenix, Atlanta, Raleigh and Dallas). 

The data is sourced from the multiple listing systems in each market, which records buyer agent commissions offered for every home listed for sale. The data does not include transactions that occur off-market (sales to REITs) nor to buyers that approach iBuyers directly, without an agent.

A History of Cost Optimization

Since the beginning, an iBuyer's biggest expense has been agent commissions -- specifically the buyer agent fee of around 3 percent when a home is resold. This fee is highlighted as “selling costs” in Opendoor's recent investor presentation.

 
image.png
 

Like many good businesses, Opendoor has attacked this cost with vigor (acquiring Open Listings, launching "Buy With Opendoor", and offering 1 percent savings when buying with a partner agent). Opendoor isn’t shy about it; the same investor presentation lays out a game plan to profitability which includes a further 0.6 percent “cost optimization” on each home sold.

 
image.png
 

In other words: Opendoor’s target for selling costs is 2 percent, of which the buyer agent commission is the single largest component.

Systematic Fee Compression

Opendoor has systematically reduced buyer agent commissions in Phoenix, its largest market, over the past 18 months. In early 2019 it started offering 2.5 percent commissions alongside 3 percent commissions (a wonderful A/B test). The results must have been promising, because Opendoor subsequently stopped offering 3 percent commissions in favor of an even-lower 2.25 percent starting in February 2020, well below Phoenix’s average buyer agent commission of 2.8 percent.

 
image.png
 

The trend and timing is similar in Dallas -- a reflection of a corporate-wide initiative to reduce expenses by lowering buyer agent commissions. At the same time in early February, Opendoor began offering 2.5 percent commissions in place of 3 percent.

 
image.png
 

Raleigh shows an identical trend with consistent timing. The average buyer agent commission is 2.4 percent, but at the same time -- February 2020 -- Opendoor pushed down its commissions to 2.2 percent.

 
image.png
 

Atlanta is where things get interesting. Opendoor began offering 2.75 percent commissions in late 2019, before introducing even lower 2.5 percent commissions in early February 2020. However, Opendoor also began testing super-low 1.5 percent commissions in late 2019.

 
image.png
 

Opendoor appears to be testing how low buyer agent commissions can go before it adversely affects time on market (agents may be less likely to show homes that are offering low buyer agent commissions).

Zillow Follows Suit

Opendoor is not alone in its drive to push down buyer agent commissions. Zillow has the same financial incentive, and has also been offering lower commissions over time in its biggest markets.

In Phoenix, Zillow matched Opendoor and began offering 2.25 percent buyer agent commissions in mid-2020, a significant reduction from the full 3 percent offered pre-Covid.

 
image.png
 

At the same time -- July 2020 -- Zillow dropped its buyer agent commission to 2.5 percent in Atlanta. The evidence suggests that, like Opendoor, this was a coordinated effort affecting multiple markets simultaneously.

 
image.png
 

In comparison to Opendoor, Zillow is both later to the party and less aggressive in its testing. Opendoor began reducing buyer agent commissions in April 2019, compared to Zillow waiting until July 2020. But the intent is identical to Opendoor: gradually reducing buyer agent commissions.

According to a Zillow spokesperson, “Agents can feel confident in a smooth, fast and easy sale when advising their client interested in a Zillow-owned home, knowing that some of the major hurdles of a traditional transaction have been taken care of prior to their clients having even toured the home.” For Zillow, the argument appears to be a lower fee for less work.

Offerpad, the third-largest iBuyer, is the outlier. It has not dropped buyer agent commissions in any of its large markets. They are “firmly committed to their agent community,” and “continue to offer buyer agents 3% in commissions,” according to a spokesperson. The data concurs.

Good for Opendoor or Good for Consumers?

Opendoor is effectively doing what consumers cannot: negotiating lower buyer agent commissions. The class-action lawsuits argue that buyer agents should “compete to be retained by offering a lower commission” -- in other words, a free market should dictate buyer agent fees.

While it is difficult for a consumer to negotiate -- and see a direct financial benefit from -- a lower buyer agent commission, it is very easy for Opendoor and Zillow. The iBuyers have the scale, financial muscle, and incentive to challenge the status quo.

Dropping buyer agent commissions has a direct financial benefit for iBuyers. The cost savings are not ending up in consumer’s pockets...yet. But Opendoor, in particular, appears to be indirectly passing some savings on to consumers. In September, it dropped its average service fee to just 5 percent, and has repeatedly stated its intent to further reduce fees.

With 2019 losses totaling over $300 million, Opendoor is highly incentivized to reduce its expenses. Systematically reducing the buyer agent commission is a logical move, but not everyone benefits. It appears that the success of the iBuyer model comes at the expense of the traditional real estate commission structure.