Zillow's Brokerage News and the 2 Megatrends of Real Estate Tech

Zillow recently announced that it was hiring its own agent employees to service its iBuyer business. At face value, the news is a relatively small shift, but is a clear reminder of several megatrends occurring in real estate tech.

An Unsurprising Move

If Zillow's announcement caught you by surprise, you haven't been paying close enough attention. For years, real estate portals around the world -- including Zillow -- have been moving closer to and getting involved in more of the transaction.


Zillow's move is a logical next step in this journey. Bringing agents in-house, as opposed to relying on a network of partners, moves Zillow closer to consumers and closer to the transaction. This megatrend -- which has been slowly occurring for years -- is covered at length in my 2018 Global Real Estate Portal Report

Ignore At Your Own Risk

With this latest news, some are suggesting that traditional agents fundamentally ignore it and focus on their own business. In other words, don't worry about the competition -- in this case, Zillow -- and just focus on providing the best service possible to your customers and clients.

That strategy is only half right. Ignoring what Zillow is doing brings its own peril; just ask travel agents and video store owners (both industries that Mr. Barton has had a hand in disrupting).

For the traditional industry, sitting still is not an option. To quote my State of the Industry presentation from January 2020:

The industry is moving so slow you can look around and think nothing is changing (or get caught up in the hype and think everything is changing). That’s why now – more than ever before – is the time to stay informed, understand the scope of change, and react appropriately.


Agents as Employees

Zillow's move is a clear reflection of a megatrend in real estate: agents as employees. Hiring agents as full-time, salaried employees (a model pioneered by Redfin) provides a number of benefits, all centered around greater control:

  • A consistent consumer experience

  • Greater operational efficiency

  • Better economics

The benefit is perhaps best illustrated by Redfin's agent efficiency, a metric that consistently stands out among its brokerage peers.


Full-time, salaried agents also lead to higher attach rates for services like mortgage and title. Next-gen brokerage models like Orchard and Homie, which also employ agents, are seeing mortgage attach rates of 80+ percent. This is only possible with an integrated end-to-end experience, powered by employees, and not a loose confederation of independent contractors.

Zillow and Redfin are not alone. Other disruptors like Opendoor and Offerpad are hiring agents for new brokerage services. With the exception of Compass (who is stuck in the matter), all of the largest real estate disruptors are moving in this direction -- that's nearly $35 billion in enterprise value pushing in this direction. It's a megatrend that's possible, but not advisable, to ignore.

Opendoor's Path to Profitability: Attaching Title and Mortgage

Opendoor's path to profitability is paved with uncertainty. A key assumption for long-term success is the ability to attach adjacent services to the transaction, such as title insurance and mortgage. Let's look at the data around Opendoor's traction to-date.


In its investor presentation, Opendoor correlates early success with attaching title and escrow services to long-term margin improvement -- and profitability. The challenge is that title and escrow are the easiest ancillary services to attach by a wide margin, and success in a few markets doesn't mean ALL adjacent services will be nearly this easy.


Title insurance is a complicated business and regulations vary by state. Opendoor is seeing early success, but it's taken years (and an acquisition of a traditional title company) to get to this stage.

The below chart shows title attach rates on the sell side, where Opendoor is the owner and sells a home. When it comes to title and escrow, not all states are created equal, and success in one may not mean success in all.


Title insurance is just one of many adjacent services. The holy grail, from a revenue and profitability standpoint, is mortgage, and it's not nearly as easy to attach. Opendoor has been in the mortgage business for about a year and is seeing much lower attach rates to its mortgage product, Opendoor Home Loans.


Compared to title Insurance, which can simply be added into the transaction by the purchaser or seller of the home (Opendoor), mortgage needs to be sold directly to consumers, which is a much more difficult and complicated proposition.

An Uncertain Road Ahead

It should be noted that what Opendoor is attempting to accomplish is not unique. Traditional real estate brokerages have been attaching title and mortgage services for years (Berkshire Hathaway's HomeServices of America, for example). The field is crowded with large, well-entrenched businesses.

Just because Opendoor is seeing early success with title insurance, the easiest adjacent service to attach (especially when you own the home), doesn't mean it will find similar success with more difficult services, such as mortgage. The evidence suggest a long, difficult, and uncertain road ahead -- in a highly-contested and crowded field of incumbents and disruptors.

Opendoor's IPO: Believing the $50 Billion Playbook

As part of Opendoor's upcoming IPO, it has revealed a strategic playbook that takes it to $50 billion in annual revenue. Achieving this is both aspirational and uncertain. What needs to be true for Opendoor to achieve this goal?


A Plethora of Phoenixes

Phoenix. The birthplace of iBuyers. Opendoor's first market. In many respects, Phoenix is the perfect iBuyer market, and has consistently been the largest iBuyer market in the world (based on sales volume).

In the first three months of 2020, Opendoor's revenue run-rate in Phoenix was $1 billion. To achieve a $50 billion run-rate, Opendoor would need to develop 50 Phoenix-sized markets (or 100 markets of half the size).

Phoenix is a mega-market; it is significantly bigger than any other iBuyer market. It accounts for 25 percent of Opendoor's total revenue, and 20 percent of its total sales volume in 2019.


It has taken Opendoor over four years to build the Phoenix market up to four percent market share and $1 billion in sales volume.


While Opendoor has a number of other large markets, none comes close to the scale of Phoenix. The average sales volumes of Atlanta, Dallas, Las Vegas, Raleigh, and Orlando have remained relatively stagnant over the past 12 months.

 
image.png
 

Opendoor's IPO documents make the claim, which is true, that market share in new markets accelerates quickly in the first year. However, it is also true that growth slows after the first 12 months. And in the case of some markets (Orlando, Las Vegas, and Dallas) sales volume has declined. 


The growth of new markets is not a straight line up and to the right. In Opendoor's case, new markets experienced initial growth followed by a plateau. This is either a deliberate beachhead strategy, or reflective of a larger challenge reaching scale.

Phoenix: Outlier or Target?

Opendoor's $50 billion plan is ambitious. To achieve it, Opendoor needs to replicate the success seen in Phoenix across 50 other markets (or 100 smaller markets) -- no small feat.

Is Phoenix the outlier or the target? The evidence of the past four years suggests the former; other markets have struggled to achieve and sustain volumes anywhere close to the levels seen in Phoenix.

The path to $50 billion -- growing dozens of new markets to significant volumes -- is far from a straight line, and is quite uncertain. Opendoor's growth is not a simple copy-and-paste of the Phoenix playbook. Launching new markets and growing them to significant volumes -- against the headwinds of competition, consumer demand, and profitability -- remains a key challenge in Opendoor's future.

Covid-19's Effect on Global Real Estate Portal Revenues

Earlier this year I outlined the ways in which the world's leading real estate portals were reacting to the pandemic, including significant customer discounts. The results are in, and the revenue impact to portals is quite varied.

Taking a Hit to Revenue

Top of the list is Rightmove, the U.K.'s leading portal, which saw a massive 37 percent drop in revenue for the first six months of 2020 compared to the same period in 2019. That's ten times greater than any other portal. The others saw more modest revenue drops of a few percentage points, with some, like Germany's ImmoScout24 and The Netherlands' Funda, managing to grow revenue.


In absolute dollar terms (and in local currency), Rightmove again tops the list, with revenues dropping a massive £38 million year-over-year. Zillow lost a substantial $15 million, but from a much larger revenue base ($450 million vs. Rightmove's £105 million in H1 2019).


Rightmove as the Outlier

The evidence clearly shows Rightmove as an outlier, while other portals managed to weather the Covid-19 storm relatively unscathed. Why?

One critical component of the answer is the severity and length of lockdown. My earlier research (featured in this Financial Times article) highlighted the U.K. as having one of the most restrictive lockdowns around the world, with a correspondingly severe drop in new listing volumes.

 
image.png
 

The second critical component is business model. Australia's portals generate most of their revenue from vendors, not agents. The U.S. portals generate revenue from selling buyer leads. Rightmove generates revenue from agents advertising houses for sale -- and if new listings drop 90 percent, there are 90 percent fewer houses to advertise.

A combination of the U.K. lockdown's severity and length, coupled with Rightmove's business model, made it especially susceptible to Covid-19. It was forced to offer its customers deep discounts for many months while the lockdown was in effect.

The pandemic affected all real estate portals -- but not equally. The more severe the lockdown, the more significant the revenue drop. 

A Note on Data Sources

To create a true apples-to-apples comparison, the data used is from the period beginning January 1 2020 and ending June 30 2020. The six months reveal a complete picture of the start, middle, and recovery from the pandemic and associated lockdowns.

The data is from each portal's residential real estate segment: Zillow's Premier Agent revenue, realtor.com's real estate revenue, Scout24's residential real estate revenue, Rightmove's agency revenue, REA Group's Australian residential depth and subscription revenue, and Domain's residential real estate revenue.

Real Estate Lessons From New Zealand's Latest Lockdown

The reemergence of Covid-19 in New Zealand, along with new lockdowns, provides further examples of its effect on the property market. As a case study for markets around the world, the results highlight less severe outcomes the second time around.

Another Drop in New Listings

New Zealand's recent lockdowns, which began on August 12th, affected the country in a similar, but less dramatic, fashion than the strict lockdowns earlier in the year. The level 4 April lockdowns were a total shutdown, which saw new listing volumes drop 85 percent. The most recent level 2 & 3 lockdowns are less severe, with a much smaller drop in new listings.


Both lockdowns saw a return to the same behaviour: a drop in new listing volumes. But the effects are wildly different, and tightly correlated to the severity of lockdown.

The monthly change in new listing volumes was most pronounced in Auckland, which was under a strict level 3 lockdown. At level 2, the rest of the country was fundamentally unaffected.

 
image.png
 

The national drop in new listing volumes was driven by the country's largest market, Auckland. However, looking at only Auckland reveals a less severe impact than one might expect. The drop in new listings is noticeable, but marginal, and new listings are still higher than the same time last year.


With buyer demand remaining strong, the natural result is a drop in inventory. But similar to new listings, it is not as severe as one might expect: A small decline, rather than plummeting inventory levels.

 
image.png
 

Inventory is certainly constrained, but it's not quite the property armageddon that is sometimes portrayed in the media.

Strategic Takeaways for International Markets

New Zealand's Covid rollercoaster highlights several lessons that can be applied to markets around the world:

  • Subsequent lockdowns appear to have less of an effect on consumer confidence in bringing a home to market. There is less overall impact on new listing volumes.

  • The more severe the lockdown, the larger the drop in new listing volumes. However, the severity is not linear; the strictest lockdowns have an exponentially greater impact on the market (Auckland's level 4 lockdown saw a monthly decline in new listings of 46 percent, compared to a monthly decline of 7 percent during the August level 3 lockdown).

  • If authorities can implement lockdowns in a targeted, focused way, the effect on the real estate market is significantly lessened. 

As the pandemic continues around the world, the evidence from New Zealand suggests that the worst for the property market may be over (at least in terms of new listings and inventory). Subsequent lockdowns appear to have less of an effect, with a targeted approach yielding the best results.

iBuyer Market Share Plummets, With a Measured Recovery Ahead

Like many businesses, iBuyers took a significant hit during the pandemic. Home purchases dropped 90 percent as the major iBuyers paused their operations, and as they come back to life, the iBuyers are rebounding cautiously and slowly, suggesting a long road to pre-pandemic levels.

Purchases Down 90 Percent

With the pandemic and associated lockdowns earlier in the year, iBuyer purchase volumes plummeted 90 percent. The major iBuyers (Opendoor, Offerpad, Zillow, and Redfin) paused new home purchases in March, citing safety concerns, before resuming operations in May.

 
image.png
 

With a gradual recovery in purchases throughout the remainder of 2020, total iBuyer purchases for the year could be half that of 2019.

Pausing new home purchases didn't stop the iBuyers from selling thousands of homes in inventory during the lockdown. In May, iBuyers only purchased 200 homes but managed to sell over 1,700, a clear sign they were trying to clear their inventory as quickly as possible. The pandemic stopped iBuyers from purchasing homes, but it didn't stop them from selling homes.


After announcing a resumption of purchases in May, all of the iBuyers have slowly ramped up their operations -- but at different velocities. In June, Zillow purchased around 50 homes, Opendoor about twice as many, and Offerpad about three times as many. The ramp up in activity is slow.

 
image.png
 

A Slow and Measured Recovery

iBuyer purchase volumes are recovering much more slowly than the overall markets they operate in. For example, in Phoenix, the overall market has recovered to pre-pandemic transaction levels. But iBuyer market share of that volume is still well below pre-pandemic levels.

 
image.png
 

The data suggests that iBuyers are taking a slow and measured approach to ramping up purchases. Many U.S. markets are hot: low inventory, massive buyer demand, and rising prices -- not a great environment for iBuyers.

Total iBuyer purchases across their top five markets are still a fraction of what they were earlier in the year.

 
image.png
 

Strategic Implications

The pandemic has put the iBuyer business model -- along with countless other businesses -- under strain. The past few months has seen them pivot and adapt, by launching traditional brokerage servicesincreasing agent referral fees, and Opendoor partnering with leading portal realtor.com.

The iBuyers are back to buying houses, but the evidence suggests a more slow and cautious approach. And once the iBuyers prove they can survive the pandemic, they're still faced with the same challenge they had pre-pandemic: profitability.

A Study of Market Recovery in the U.S., Sweden, and New Zealand

New listing volumes are an important lead indicator for the real estate market. The U.S., Sweden, and New Zealand offer three contrasting case studies of pandemic response and real estate market recovery.

Varying Drops in New Listing Volumes

The U.S. real estate market experienced a steep decline in new listings coming to market during lockdown in April and May. The recovery has been slow and gradual (a checkmark), with levels still down from last year. The pent-up supply from lockdown hasn't hit the market; there's a huge hole in available inventory.


In New Zealand, there was a hard and fast lockdown that resulted in an immediate and sharp drop in new listing volumes. However, once lockdown was lifted and Covid-19 was eliminated, the market quickly bounced back to normal. Unlike the U.S., new listing volumes surged to higher than normal levels -- a natural result of pent-up supply from the lockdown coming to market.

 
image.png
 

Sweden never really went into lockdown, with much of the country carrying on as normal. The real estate market followed suit, with new listing volumes only dipping slightly in April and May compared to the same time last year. There is no real market recovery because the market never dropped away like in the U.S. and New Zealand (the summertime drop is seasonal).


Summary of Evidence

All three countries are at different points on the spectrum of pandemic response and real estate market recovery.


Key observations:

  • With the strictest lockdown, New Zealand experienced the largest drop in new listing volumes (65%), but recovered quickly with new listing volumes up 20%.

  • With a moderate lockdown, the U.S. experienced a moderate drop in a new listing volumes (40%), but recovery is taking longer, with new listing volumes still down 5% compared to last year.

  • With no lockdown, Sweden never experienced a drop in new listing volumes. The market continues to operate normally.

The data suggests that the harder the lockdown, the bigger the drop in new listing volumes -- and the faster the recovery. 

Many thanks to Redfin, Hemnet, and realestate.co.nz for the market-specific data.

New Zealand's V-Shaped Real Estate Recovery

With zero cases of Covid-19 in the community, New Zealand is one of the very few countries where life has returned to normal. After two months of lockdown, the country's property market is demonstrating healthy market dynamics on its road to a true V-shaped recovery -- and serves as an interesting comparison to the U.S.

New Listings Supply

New listing volumes at Barfoot & Thompson, Auckland's largest real estate agency with over 40 percent market share, rebounded quickly after the country emerged from lockdown. New listing volumes in June were higher than normal -- an expected effect of pent up supply from the lockdown.

 
08552899-6bbe-4d83-bc75-78309277d340.png
 

At a national level, new listing volumes (as tracked from a major real estate portal) show a similar trend: an extreme dip during lockdown, followed by a healthy rebound.


Compare this to the U.S., where new listing volumes (as tracked nationally by Redfin) are still depressed and below last year's numbers.


New listings -- supply -- are the lifeblood of a healthy property market. A lack of inventory can create liquidity problems in a market recovery.

Buyer Demand

Critically, buyer demand has closely matched seller demand in New Zealand. The number of sales in Auckland has rebounded quickly and strongly, reaching levels higher than last year in June.

 
71266fc0-e85e-494f-960d-f307b479c79a.png
 

Comparatively, home sales in the U.S. are still recovering and below last year's levels. But the overall trend is the same: a temporary dip followed by a recovery. New Zealand appears to have recovered fully, while the U.S. is still catching up.


Inventory

A strong measure of a healthy market is inventory -- the number of active listings in a market -- and which direction it is trending. In some U.S. markets, buyer demand is outstripping new listings coming to market, creating a precipitous drop in inventory.

 
c758e122-81c4-4ae2-849b-cb769230f883.png
 

At a national level, inventory levels in the U.S. continue to drop in a season when they normally grow. Buyers are picking up houses faster than sellers are bringing new homes to market.


The story is different in New Zealand. Inventory levels in Auckland have remained relatively constant through lockdown, and -- most importantly -- have not dropped as buyers and sellers come back to the market. In other words, buyer demand is being matched by seller demand.


The evidence suggests that New Zealand's housing market is experiencing a true V-shaped recovery. Buyers and sellers are back on the market at levels similar to or exceeding last year (driven by pent up demand).

In New Zealand, life returned to normal fairly quickly, and the housing market appears to have followed suit. As the U.S. continues to wrestle with waves of the pandemic and increasing uncertainty about the future, the housing market is reacting with greater extremes. There is a frenzy of buyer activity, while new listing volumes continue to lag historical levels -- all leading to an unprecedented drop in inventory.

What Happens When Two Top Real Estate Portals Merge?

Zillow and Trulia in 2014. Immowelt and Immonet in 2015. When massive real estate portals join forces, it is for one reason: market power. These mega-mergers of leading real estate portals highlight the power of market dominance through greater reach, greater pricing power, and accelerated revenue growth.

Germany: Immowelt and Immonet

In 2015, Axel Springer brought together Immowelt (IW) and Immonet (IN), the #2 and #3 real estate portals in the German market. The combined entity managed to increase ARPA (average revenue per advertiser) 40 percent over the following two years, with only 5 percent customer churn -- a noteworthy achievement.


The merger allowed the combined entity to nearly double the pace of ARPA growth from €6/quarter pre-merger to €11/quarter post-merger.

The key to Immowelt's success was a strategy of forcing customers to adopt a more expensive DUO bundle (one contract, two portals), whereby listings appear on both sites. After 18 months, an impressive 85 percent of customers had adopted the DUO bundle, rising to 99 percent a year later -- all with minimal customer churn.


In 2018, Immowelt began converting customers to a more expensive DUO5 (five listings) bundle. Over the subsequent two years, customer churn increased to 19 percent while ARPA growth remained high at 33 percent.

Supercharging Zillow's Revenue Growth

The merger of Zillow and Trulia was the catalyst for strong revenue growth at the combined entity. In the two years following the merger -- and after consolidating the revenues of both businesses -- revenue increased a massive 52 percent.


In the case of Zillow and Trulia (and similar to Immowelt and Immonet in Germany), post-merger revenue growth was driven by ARPA and not an increase in paying customers. In the year following the merger, and after the customer bases were consolidated, the number of paying customers dropped by 11 percent while ARPA increased 42 percent.


The merger increased the market dominance of the combined entity, and allowed Zillow to increase its pace of revenue growth over the following three years.

 
image.png
 

The slope of the line -- the increase of revenue coming into the business, not as a percentage, but in absolute dollars -- materially shifted post-merger. Pre-merger, Zillow added an average of $5.9 million in new revenue each quarter; post-merger it averaged $9.6 million.


(And just for fun, here is realtor.com's corresponding revenue growth after its acquisition by News Corp in 2014, adding an average of $2.8 million in new revenue each quarter. There's a premium to being the market leader.)

 
image.png
 

More Money, More Value

The mergers allowed both groups to materially grow revenue, primarily through ARPA increases, at an accelerated pace.


While prices did increase after the mergers, it came with a corresponding increase in customer value. The combined entities were able to deliver more exposure and more leads for their customers. Zillow's increasing ARPA was closely matched by an increase in leads.


While ARPA increased 42 percent in the year after the merger, it was coupled with a 48 percent increase in total leads and an 11 percent decline in customers. The net result was a drop in the average price per lead.


Zillow's customers were paying more, but they were paying more for increased value.

The case was similar in Germany. Internal research showed that, on average, customers that advertised on both sites saw the number of leads per listing more than double. Customers were paying more, but were deriving more value.


The merger of two real estate portals consolidates market and pricing power within one organization -- allowing it to quicken its pace of growth. But in the cases above, an increase in prices was accompanied with a corresponding increase in value, arguably a good deal for customers and consumers.

Inventory Levels Down 20–40% Across U.S. Markets

There's a reason I've been talking about new listing volumes as the best lead indicator of the health of the real estate market. That reason is now clearly manifesting: a precipitous decline in available inventory across the U.S. Less new listings leads to less inventory, which is causing a supply vs. demand imbalance.

National New Listings and Active Inventory

Nationally, new listings dropped significantly -- down 40+ percent -- and are slowly recovering. The velocity of that recovery has slowed in recent weeks; new listings are coming to market slower, and are still down 18 percent compared to last year.


The significance is that when new listings stop coming to market, overall supply -- inventory -- drops. There are less available homes for prospective buyers to purchase. Nationally, the number of active listings is down 25% as of June 21st. And the slope of the line is heading down, both absolutely and compared to last year.


Active Listing Tracker

It's with this issue in mind that I'm happy to announce the addition of an Active Listings chart to my Real Estate Market Tracker. As with the other charts, it's interactive, so plug in whatever markets you want to compare.

An overview of some of the biggest markets in the U.S. shows, with few exceptions, that the number of active listings in most markets is down 20–40 percent compared to last year. Demand is strong, and buyers are gobbling up the available inventory.


Markets like Atlanta, Dallas, Seattle, Chicago, Phoenix, and others show a strinkingly common downward trend. Compared to last year, the number of active listings is plummeting downward. 

 
image.png
 

The Significance of Inventory

A drop in active listings isn't necessarily a problem, but it's a significant disruption to the market dynamics of supply and demand. If the amount of active buyers remains constant, and the available inventory drops, house prices will rise.

In many markets -- and nationally -- the available inventory continues to drop, and doesn't appear to have stabilized yet. The supply vs. demand imbalance, especially in certain markets, is acute. And with the recovery of new listings coming to market slowing, and buyer demand remaining strong, it does not appear to be changing anytime soon.

Observations on the U.S. Market Recovery

The U.S. real estate market is in the midst of a recovery. Important lead indicators are up from their lows of the past several months, and nearly every graph is moving up and to the right. But a high-level snapshot does not paint an accurate picture; a deeper look reveals the varied nature of the recovery rollercoaster.

A National Look

Redfin does an excellent job of presenting an up-to-date and accurate picture of the U.S. market. Starting at the top of the funnel -- new listings -- the recovery is clearly visible. New listings coming to market are swiftly rising, and are currently down only 18 percent compared to the same time last year (and yes, it looks like a checkmark).

 
ab0d2366-1a6e-48d6-bfc4-06e2a1fa6608.png
 

Pending home sales took a big hit in April and May, but are recovering just as quickly as new listings, a sign of strong buyer demand (likely driven by low mortgage rates). Pending sales are nearly at the same level they were last year.

 
4b54ec5f-c5d1-400d-ae5e-ee3d298ea125.png
 

Home sales lag all other indicators -- it can take one to three months between a new listing coming to market and a home being sold. Transaction volumes will recover, but it may take many months.

 
1f955109-4b90-43e8-80f2-c1c3796de43c.png
 

National data paints a straightforward, if over-simplistic, picture of a real estate market in recovery. A market-by-market analysis shows the varied nature of recovery.

Market-Specific Analysis

There are many different markets in the U.S., and each is recovering differently. Utilizing my Real Estate Market Tracker (which is an interactive tool; give it a spin), it's clear that all markets are seeing an uptick in pending sales, but at different rates.

 
8e3a79f1-167e-4fbd-a0cd-5221e5ad7f57.png
 

Looking at the data on a year over year basis reveals an interesting trend: Half the markets surveyed are up compared to last year, while half are down significantly.

 
cb2722c9-ca14-465f-b7c7-d70136ded5ca.png
 

For example: Pending home sales in Austin and Tampa are up 30–40 percent after a quick recovery, reflecting very strong buyer demand. In the major coastal cities like L.A. and NYC, pending sales are still down 30–60 percent compared to last year.

 
59d0ed52-8eb6-4dda-9afd-211da6dd4461.png
 

The picture of recovery in King County, Washington (Seattle) is common in many markets: Gradual. New listings coming to market, which were down 50 percent in March, have slowly increased over the span of three months, and are still not at historical levels.

 
6651f3cc-7121-430b-bc1f-88f954181a80.png
 

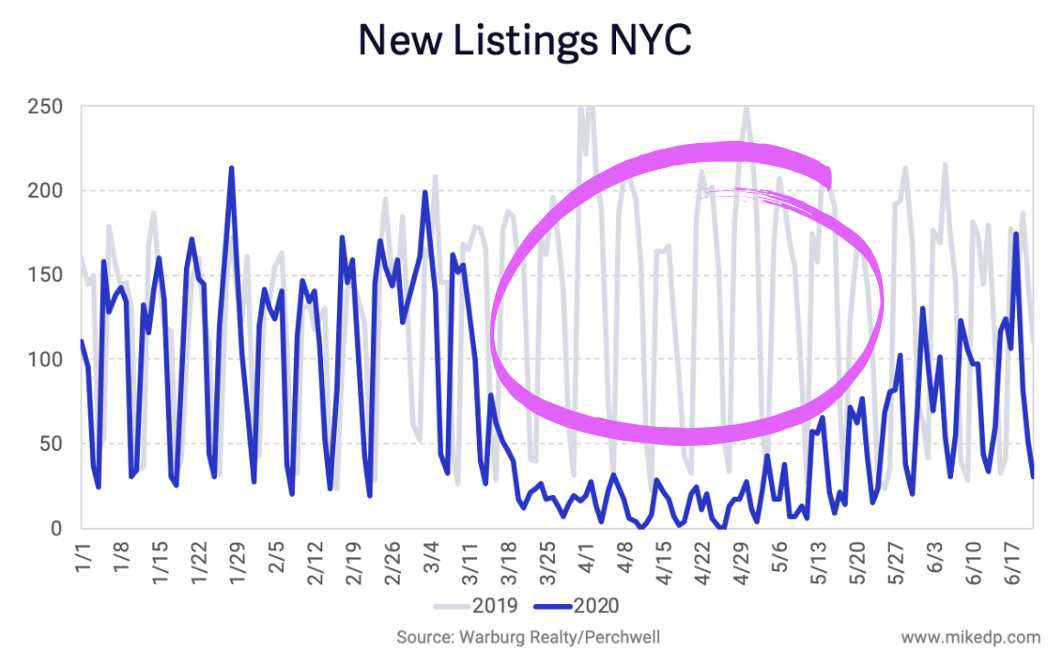
New York City saw the most severe drop in new listings -- down 85 percent -- and is finally seeing an uptick (call it a surge?) in new listing volumes after three months of real estate lockdown.

 
cb77b813-e940-4eb4-82f8-982e78832bb0.png
 

But the big question for NYC is: What happens to the missing three months of new listings? It's a massive volume. Will they come to market now, over the next few months, or will it remain a giant hole in 2020 transaction volumes?

The Key Takeaway

Looking at only the national numbers paints an over-simplified version of the U.S. market recovery. It looks like a smooth, predictable rollercoaster that has gone down and is steadily heading back up. In reality, there are ten thousand different rollercoasters moving independently of each other, all at different speeds and at different points on different tracks. Not all markets will recover the same.


If you enjoy data as much as I do, give the Real Estate Market Tracker a spin. Compare any number of markets in the U.S. I also highly recommend visiting Redfin's Data Center and Zillow’s Weekly Market Report for national and market-specific data.

iBuyers Turning Into Brokers Turning Into iBuyers

The biggest evolution of the iBuyer business model in four years quietly occurred last week: Opendoor and Offerpad launched traditional brokerage listing services. Both companies will now list homes directly, alongside their core instant offer business, underlining the growing convergence of iBuyers and the traditional industry.

 
Screen Shot 2020-06-06 at 1.22.20 PM.png
 

The Value of Seller Leads

One of the biggest opportunities in iBuying is monetizing seller leads (consumers that request an offer but don’t sell to an iBuyer). At scale, converting even a portion of these high-intent leads to a traditional listing could be a billion dollar opportunity.

iBuyers only buy a small fraction of homes from consumers that request offers. In 2019, Zillow bought 6,500 houses of the 264,000 consumers that requested an instant offer (about 2.5 percent). The remaining 257,000 homeowners didn’t sell to Zillow, but many -- upwards of 40 percent -- eventually sold via a traditional listing.

 
Screen Shot 2020-06-08 at 1.44.26 PM.png
 

Historically, iBuyers have struggled with converting seller leads. Zillow farms these leads out to its Premier Agent network, and Opendoor has a network of Partner Agents.

It’s a difficult process. Connecting consumers who are interested in an instant sale to a real estate agent feels like a bait-and-switch, and because the partner agents are independent contractors, there’s an inconsistent experience and misaligned incentives.

Launching a listing service is an effort to make a sale on every consumer that enters the funnel. It moves from a “take it or leave it” product choice to presenting consumers the illusion of choice (would you like the instant offer or the traditional sale?), a common sales tactic to increase conversion.

The Lines Between Traditional and Disruptor Are Blurring

It’s not just iBuyers that have evolved their business models. Traditional brokerages are adopting new, disruptive models, and making them their own.

Traditional agents and brokers are providing instant offers and “buy before you sell” services alongside their listing services, utilizing start-ups like zavvie and Homeward. A growing list of brokers have raised capital and have launched their own iBuyer programs -- Lamacchia Realty, Matt Curtis Real Estate, and 8z Real Estate -- while industry behemoths have launched programs like Keller Offers, Redfin Now, and Realogy’s RealSure.

 
Screen Shot 2020-06-08 at 3.18.45 PM.png
 

Over time, by adding these new tools to their toolboxes, traditional agents are slowly turning into iBuyers themselves -- or at least offering their full range of services. New ideas are not the exclusive domain of start-ups and disruptors; the best ideas are being co-opted by the traditional industry.

Strategic Implications

With this move, Opendoor and Offerpad have achieved feature parity with traditional brokerages. They are no longer an option to be considered as an alternative to a traditional listing; they’re a complete solution for any homeowner.

Both Offerpad and Opendoor are acting as their own listing agents, utilizing salaried employees to list and sell homes (exactly how they currently sell thousands of homes purchased from consumers). In some markets, Opendoor is also using partner agents for this new service.

The tendency of disruptors to utilize internal, salaried agent employees is noteworthy. Employees offer a consistent, controlled experience, which yields higher conversion rates for converting seller leads and ancillary services (which is why Redfin’s agent productivity is exponentially higher than the industry average, and why fixed-fee brokerage Homie has an 85+ percent attach rate on its mortgage product).

Ultimately, this new service -- which is in the early stages and not fully rolled out -- represents a way for iBuyers to make money without having to actually buy houses. After four years and billions of dollars invested into iBuying, it’s a significant adjustment to the core business model.

The Pandemic’s Varied Effect on International Real Estate Markets

The pandemic affected international real estate markets in strikingly different ways. Markets with stringent lockdowns saw new listings plummet by 90 percent, while other markets saw no change. And as the world begins to recover, the data suggests that the longer and more severe the lockdown, the faster the initial recovery.

New Listings

The number of new listings coming to market is a key indicator of a healthy real estate marketplace, representing high-intent seller demand and available inventory. The decline in new listing volumes across seven countries has varied wildly, from no change to a 90 percent drop, depending on the market and its associated lockdown.

Screen Shot 2020-05-20 at 7.13.23 AM.png

Unsurprisingly, the drop in new listing volumes is tightly correlated to the severity of lockdown imposed by national and local governments. Of the nations analyzed, Italy and the U.K. had the most stringent lockdowns, with many real estate activities deemed non-essential and severely limited. The drop in new listings was greatest in these markets: between 75-90 percent.

The Australian, U.S., and Canadian real estate markets were less restrictive, and the drop in new listings reflects that: 40-50 percent at a national level. In the U.S., that number varies greatly by state, with some markets (Pennsylvania, Michigan, and New York) mirroring the severe drop of up to 90 percent seen in the U.K. and Italy.

Most surprisingly, some markets were barely affected. The Netherlands and Sweden imposed “intelligent lockdowns” far less restrictive than many other countries. As a result, The Netherlands in particular hasn’t seen a significant drop in new listings; rather, it’s enjoying annual highs. Interestingly, new listing volumes in Sweden have seen a limited, delayed decline -- about a month after most other markets -- of 20 percent.

Portal Traffic

Web site and mobile traffic to real estate portals suffered an expected drop, but quickly recovered in most of the markets analyzed. 

Screen Shot 2020-05-20 at 7.13.24 AM.png

Once again, markets with “intelligent lockdowns” -- The Netherlands and Sweden -- saw less of a drop and are currently experiencing annual highs. Australia and the U.S. quickly recovered and are up from last year, while the U.K. lagged behind due to its stringent lockdown (why browse when the market is closed).

A less restrictive lockdown doesn’t directly affect someone’s browsing behavior. But the closer to “normal” a lockdown is, the more consumers will continue their normal portal browsing behavior.

A Fast Recovery

Based on the evidence from the U.K. and Italy, it appears that the longer and more severe the lockdown, the faster the recovery. Both countries have seen a surge in new listing volumes after restrictions were lifted, a signal of strong pent-up demand. The following chart shows the rise in new listings after the U.K. reopened the housing market on May 13th.

Screen Shot 2020-05-19 at 2.04.47 PM.png

That market behavior is similar to two of the hardest hit U.S. markets -- Pennsylvania and Michigan -- which prohibited most real estate activity and saw new listings drop 70-80 percent. After easing restrictions, Michigan’s Detroit and Grand Rapids saw an immediate surge in new listings come to market -- similar to Italy and the U.K. 

Screen Shot 2020-05-18 at 5.20.41 PM.png

The evidence suggests that once restrictions are lifted in the hardest hit markets, new listings rebound quickly. However, new listings are only one component of a full market recovery. Buyer demand, leading to completed real estate transactions, will come over time -- and it’s unclear how long that recovery will take.

A Note on Data Sources

This analysis uses previously unpublished data from a number of international real estate portals and organizations: 

  • Hemnet (Sweden’s top real estate portal)

  • Funda (The Netherlands’ top real estate portal)

  • REA Group (Australia’s top real estate portal)

  • Zoopla (U.K.’s #2 real estate portal)

  • Fourwalls and rennie (Canada)

  • A top Italian real estate portal (Thanks!)

  • Redfin’s Data Center (U.S. new listing volumes)

  • Zillow’s quarterly shareholder letter (U.S. traffic volumes)

Thank you to the leading real estate portals and other organizations around the world that collaborated with me to produce this first-of-its-kind international analysis. How does your market compare? Let me know!

An Analysis Of Pending Sales, A Proxy For Buyer Demand

Much of my market research has focused on new listings coming to market, a strong proxy and indicator of seller demand. Now I've turned to pending sales -- offers being made and accepted on a home -- as an equally strong proxy for buyer demand.

As expected, the number of pending sales is beginning to rebound in some markets as restrictions ease.

Pending sales -- representing increased buyer demand -- are increasing in a number of cities like Tampa, Chicago, and Seattle. Following a significant dip around the end of March, the number of pending sales has steadily increased throughout April, in the all-too-familiar checkmark shape.

However, not all markets are recovering. Several major East and West Coast metros, including New York City, Philadelphia, San Francisco, and Los Angeles, are still in their lows and have yet to see the number of pending sales recover.

8728631d-6c68-4e0d-bb96-d18352bbf795.png

Comparison to Last Year

The analysis above simply looks at the number of pending sales over time. Given the seasonal nature of real estate, a second, important dimension to consider is year-over-year performance: How does 2020 compare to 2019?

An annual comparison shows many markets down between 20-80 percent compared to the same time last year, with some recovering, and others still flat.
 

Some markets, like Austin, have recovered quickly with pending sales at the same level of last year -- highlighting strong buyer demand. While it is recovering, Seattle is still down a significant 20 percent from last year, with New York and San Francisco still down 60-80 percent from 2019 volumes.

3cfeec06-cf15-41c4-a6dd-f498dbbb8fb2.png

The advantage of plotting data over time is the ability to reveal momentum. Markets like Nashville, Raleigh, and Charlotte are all trending lower; buyer demand is not picking up as quickly as last year. Not all markets are in recovery mode.

Key Takeaways

The data suggests that buyer demand (as represented by pending sales) has been significantly effected by the pandemic. Volumes are down over 35 percent nationally, with some markets down as much as 60-80 percent compared to last year. Buyer demand is beginning to recover in some markets, but not all.

Try it Yourself

I was recently quoted in an article on Curbed: "No matter what narrative you have you can support that story with data. You can find data to support any story you want, whether it’s everything is fine, it’s the end of the world, or something in between.”

My goal with this analysis is to replace uncertainty with data, and to give you the tools to explore the data directly: try it out with my Real Estate Market Tracker.

(It's worth noting that while the data comes from Redfin, it's not perfect. Several markets, including Atlanta, Dallas, and San Antonio were removed from this analysis because of significant data issues. I hope to include them in the future.)

Growth Challenges: Zillow vs. realtor.com

Last week both Zillow Group and News Corp’s realtor.com announced quarterly financial results, revealing two companies in starkly different periods of growth. Zillow is growing, realtor.com is not, and the latter is making significant moves to change course.

Differing Growth Trajectories

The largest revenue driver for each business is selling leads to real estate agents: Zillow’s Premier Agent program and realtor.com’s real estate revenues.

In the most recent quarter ending March 31, 2020, Zillow’s premier agent business grew by $24 million (11 percent) compared to the same period in 2019. By comparison, realtor.com’s real estate revenue did not grow at all. In the quarter before that, Zillow’s premier agent program grew by $12.5 million (6 percent), compared to $4 million (4 percent) at realtor.com.

 
Screen Shot 2020-05-11 at 10.02.53 AM.png
 

Over the past six months, Zillow's real estate lead gen business has demonstrated solid growth while realtor.com's has struggled.

Leadership Changes

Over the past two years, Zillow’s premier agent program has certainly had its challenges, with growth slowing significantly for a period of time before reaccelerating. The decline -- and resurgence -- in growth pivoted around a leadership change in February 2019, with Rich Barton taking the reins as CEO.

 
Screen Shot 2020-05-11 at 9.05.24 AM.png
 

Annual revenue growth at realtor.com has fluctuated over the past two years, dipping into negative territory on a number of recent occasions. In the past year, revenue growth has only been positive in one out of four quarters. Similar to Zillow, a leadership change occurred in the midst of the decline, with the departure of the CEO in June 2019.

 
Screen Shot 2020-05-11 at 9.05.22 AM.png
 

Both companies have struggled with revenue growth, and investors -- along with corporate owners -- clearly don’t like stagnation. Chief executives were replaced in both companies when revenue growth stalled.

The recent strategy at realtor.com reflects a significant effort to correct its past lackluster performance. This year, a permanent CEO was appointed in January, several longtime execs were replaced by a pair of Opcity leaders in April, and significant layoffs were enacted in May. These are all bold moves made in an effort to restore growth.

Research Study: Measuring Compass’ Agent Productivity

It’s not easy to measure agent productivity. There’s no magic number to compare one agent against another, nor measure one brokerage against another. True agent productivity -- selling more houses, for more money, faster than the competition -- is multi-dimensional and nuanced, influenced by technology, the market, and brokerage operating models.

Compass has invested tens of millions of dollars into technology over the years and has claimed its agents are more productive than its peers, in no small part to its technology platform. “One of Compass’ competitive advantages is that every employee has a singular focus on agent productivity,” its CEO told Barron’s in 2018, while later claiming agents saw a 25 percent boost in transactions in their first year.

Using four methods of analysis, this research study aims to provide a deeper look at Compass’ agent productivity compared to its industry peers.

Research note: This analysis utilizes data from the REAL Trends 500, which ranks the largest real estate brokerage firms in the U.S. by sales volume and transaction count, in addition to my own independent research. To be fair to Compass and account for its massive growth during 2019 (8,000 to 15,000 agents), this analysis uses a midpoint agent count (11,500) for all 2019 calculations.

Defining Productivity

Agent productivity is a function of two inputs -- the number of transactions closed and the average home price -- which produces an agent’s sales volume (the total value of homes sold in a year).

 
Screen Shot 2020-04-22 at 3.16.28 PM.png
 

Average home price is a variable that’s difficult to change, and is highly dependent on the market. The number of transactions per agent is a result of many factors; one would expect efficiency gains made through technology to show up here. To measure productivity, we must look not only at sales volume, but the number of transactions an agent closes.

Method #1: Production

The most commonly accepted method of evaluating -- and comparing -- the relative productivity of real estate agents is sales volume: the total value of homes sold during a period of time. This metric, called production, translates directly to income, paid as commissions. The more revenue an agent generates, the more productive they are.

The following chart looks at the 20 largest U.S. brokerages by total sales volume during 2019, ranked in order of average sales volume per agent. On a per agent basis, Compass ranks near the top for average agent production.

 
Screen Shot 2020-04-22 at 11.01.35 AM.png
 

Evaluating agent productivity based on sales volume provides a broad basis for comparison, but misses several nuances. As outlined above, total sales volume is heavily influenced by the type of market an agent operates in. Agents operating in a luxury market can sell fewer houses and achieve a high sales volume.

Sales volume per agent is a great metric to track how much revenue an agent generates -- and arguably what a brokerage cares about most -- but it doesn’t fully capture the efficiency nor productivity of an agent. Those factors, which can be enhanced by technology or a unique operating model, requires deeper analysis.

Method #2: Transactions

The number of transactions an agent closes in a year is another measure of agent productivity. One could argue that a more efficient agent -- supported by technology -- would be able to close more deals, faster.

The following chart looks at the 20 largest U.S. brokerages based on total transaction count, ranked by the average number of transactions closed per agent. Redfin, with a unique operating model employing salaried agents, is the clear outlier. Compass is in the middle of the pack with an average of 7.4 transactions closed per agent in 2019.

 
Screen Shot 2020-04-20 at 2.55.42 PM.png
 

Benchmarking Compass against the average number of transactions closed per agent at the 20 largest brokerages, the 20 largest brokerages excluding Redfin, the four largest brokerages, and the two largest brokerages, shows Compass agents slightly below average.

 
Screen Shot 2020-04-28 at 4.26.06 PM.png
 

Simply looking at transaction counts fails to account for the relative price points of homes in different markets. While an agent in a high-end market may close less transactions, it may be a result of higher priced homes that take longer to sell, rather than overall efficiency.

Plotting both the average number of transactions and the average sales volume per agent again reveals Redfin as the outlier, while Compass is clustered with its high-end peers.

 
Screen Shot 2020-04-20 at 3.00.42 PM.png
 

Compass agents clearly produce a high sales volume, but overall efficiency as measured by transactions per agent reveals Compass agents to be slightly lower than the industry average.

Method #3: High-End Peers

The average sales volume per agent is heavily influenced by average home prices. High-end agents, doing fewer transactions each year, have a disproportionately higher sales volume due to high home prices. This makes it difficult to compare productivity at a high-end brokerage like Compass, with an average home price of $1.1 million, to a mid-market brokerage like Howard Hanna, with an average home price of $225,000.

One method to solve for this is to “freeze” the average home price in our equation, by only comparing Compass to its high-end peers. The following brokerages have average home prices similar to Compass, +/- $200k in value.

 
Screen Shot 2020-04-29 at 7.37.41 AM.png
 

The average sales volume per agent at these five brokerages shows Compass in the middle of the pack in terms of agent productivity. On average, Compass agents are neither more nor less productive than their up-market peers.

 
Screen Shot 2020-04-22 at 11.07.53 AM.png
 

Looking at the other measure of efficiency, the average number of transactions per agent, similarly reveals Compass to be in the middle of the pack. On a per transaction basis, compared to its high-end peers, Compass agents are on average...average; neither higher- nor lower-performing.

 
Screen%2BShot%2B2020-04-22%2Bat%2B11.07.56%2BAM.jpg
 

Method #4: Itself

Ultimately, perhaps the best peer comparison for Compass is itself. If “every employee has a singular focus on agent productivity,” one would assume improvements being made over time.

Between 2018 and 2019, the average sales volume per agent (using the same midpoint agent count calculations for each year) at Compass declined, from $9.1 million to $7.9 million.

 
Screen Shot 2020-04-22 at 11.14.18 AM.png
 

Was Compass alone with dropping sales volumes per agent? The evidence suggests it (almost) was, with three out of its four high-end peers increasing their average sales volumes per agent during the same period.

 
Screen Shot 2020-04-22 at 11.08.35 AM.png
 

Summary of Evidence

It’s undeniable that Compass agents have a high average sales volume; more than twice that of industry behemoths Realogy and HomeServices of America. But it begs the $6.4 billion dollar question: is it because of the agent, or because of Compass.

There’s no easy answer when the question is agent productivity. The evidence above -- coming from four different angles, and using all available information -- suggests the following:

  • Compared to the industry average, Compass agents generate a high sales volume.

  • The high sales volume is driven by high home prices, rather than agent efficiency.

  • Agent efficiency and productivity improvements, as a result of a sizable technology investment, have yet to materially manifest themselves.

Timing is a final, important consideration. As I outlined in an earlier analysis, The Three Eras of Compass, it was not until 2019 that the company’s technology investment truly matched its rhetoric. Unrivaled technology investment to boost agent efficiency has been a key component of the Compass narrative and an important recruiting tool, but — through the end of 2019 — remains an aspiration rather than a clearly demonstrable reality.

Introducing the U.S. Real Estate Market Tracker

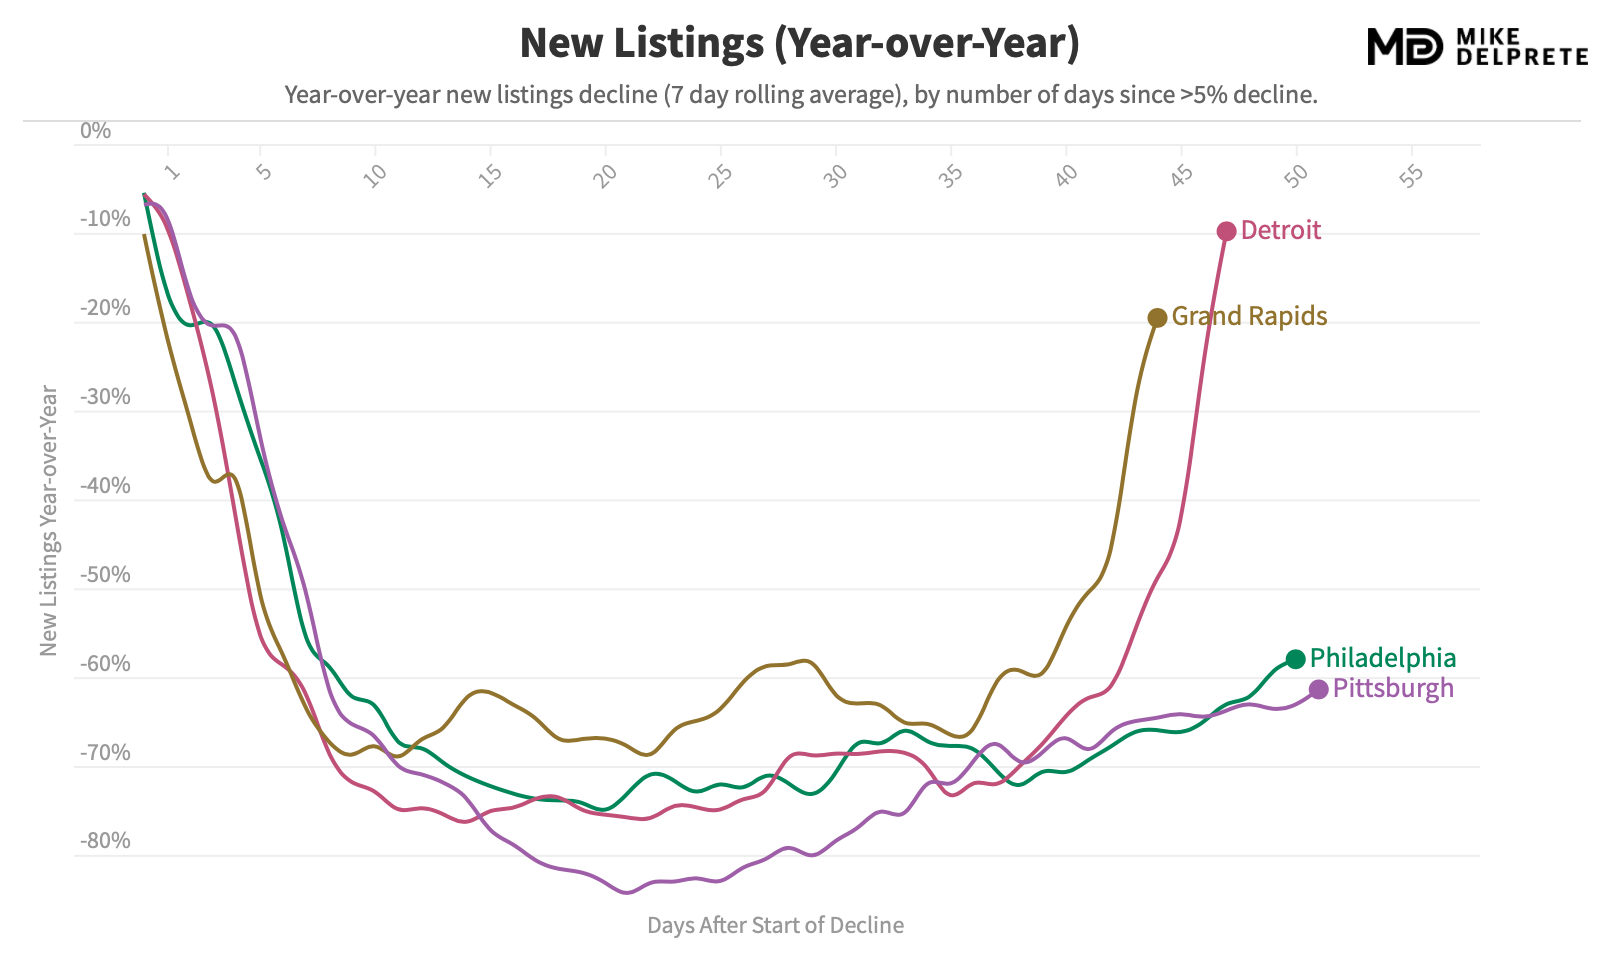
New analysis shows a significant decline in new listing volumes across all major U.S. markets, but at vastly different rates and timing. Major metros like Los Angeles, New York City, and Chicago were affected the earliest, while Denver and Phoenix didn't experience a significant decline until 15-20 days later.

The drop in new listings varies widely between 40 and 80 percent. New York, Pennsylvania, and Michigan have been the hardest hit markets, which is a reflection of more stringent lockdown measures. 

Possible recovery appears to begin after 30-35 days of decline as homeowners begin listing their homes on the market again. San Francisco, Los Angeles, and Seattle have all recovered from their lows. However, many markets are still at the bottom of the curve, and some, like Phoenix and Denver, may not yet have hit the bottom.

The speed of decline varies across markets. Listing volumes dropped twice as fast during the first ten days in New York City, Philadelphia, and San Francisco, compared to a more gradual decline in Dallas, Phoenix, and Atlanta.

Spotlight on iBuyer Markets

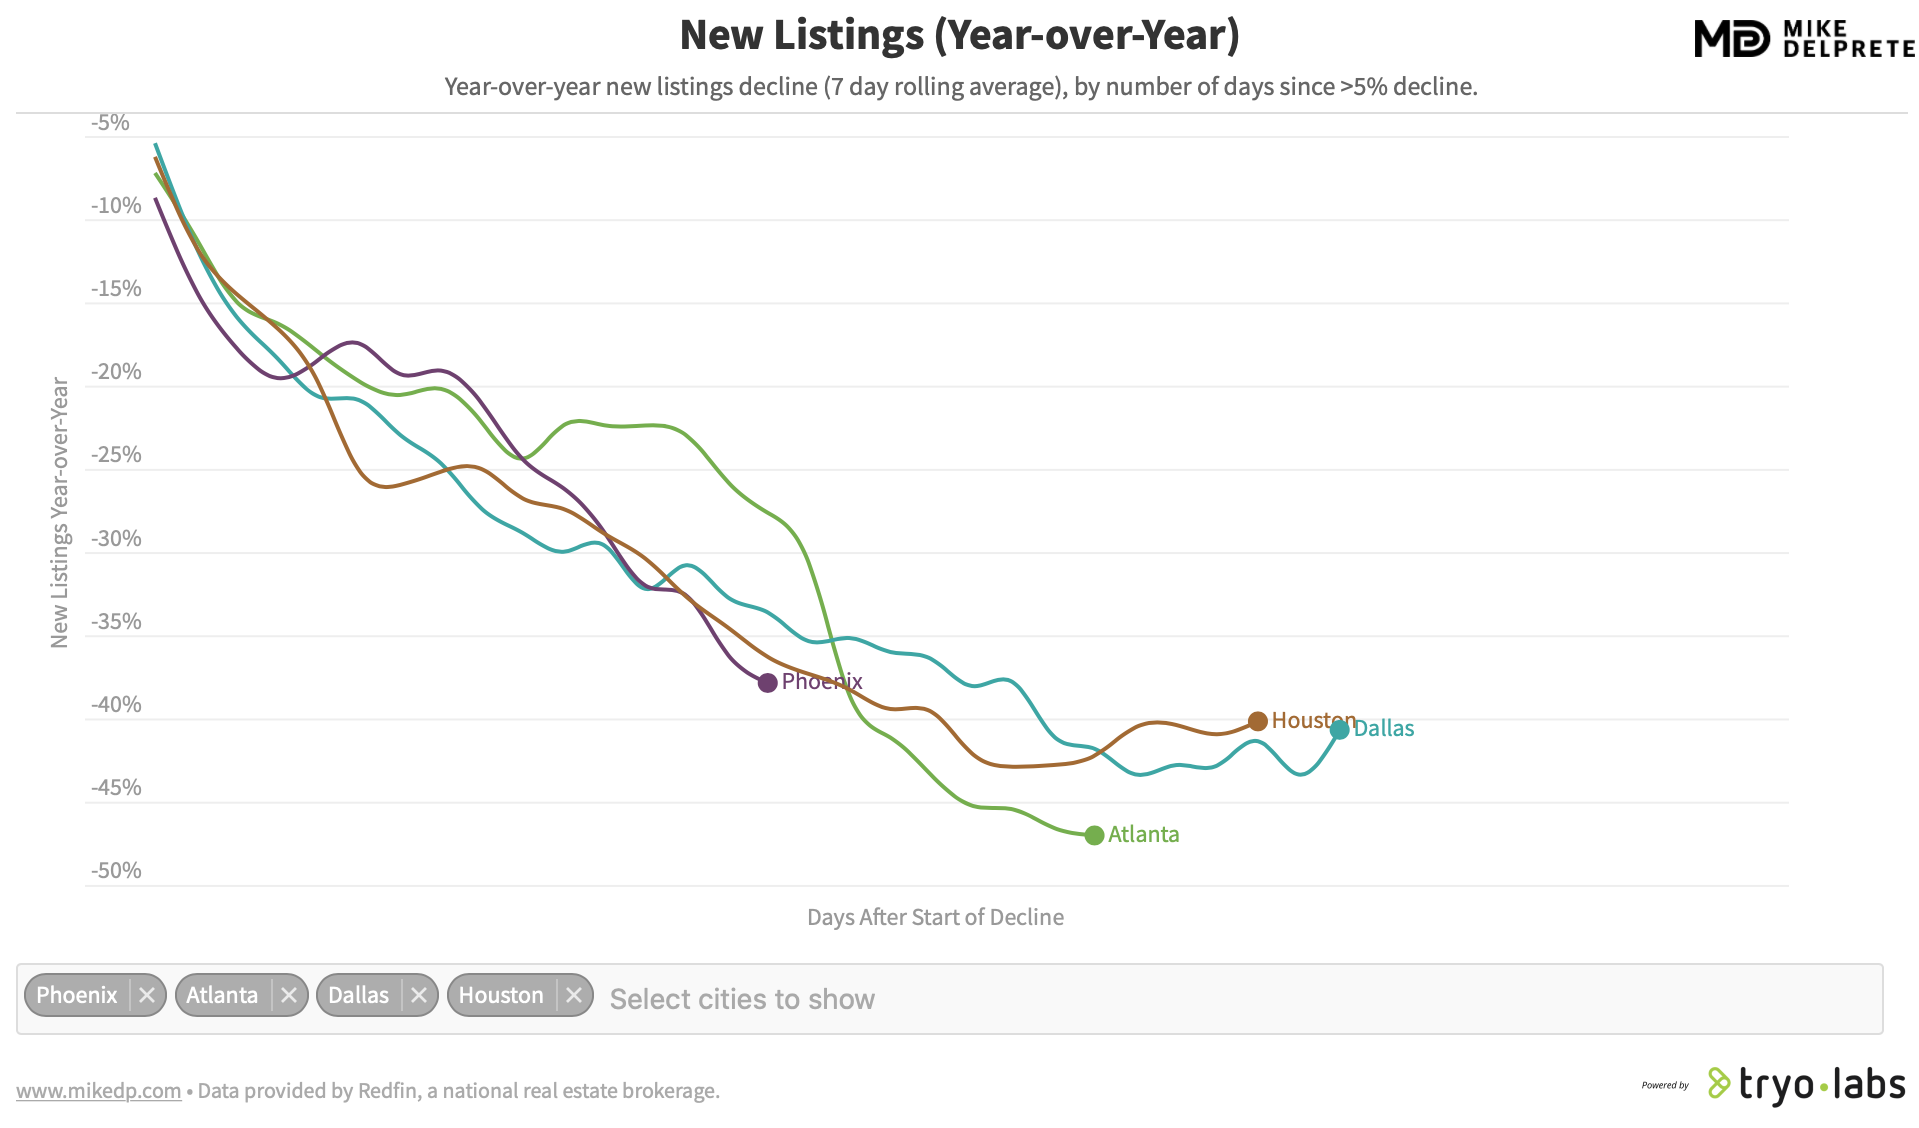
The country’s major iBuyers -- Opendoor, Zillow, Offerpad, and Redfin -- do most of their business in Phoenix, Atlanta, Dallas, and Houston. Like the rest of the country, those markets have seen significant drops in new listing activity, down between 40 and 50 percent.

Screen Shot 2020-04-25 at 5.54.07 PM.png

Houston and Dallas appear to have hit bottom; both markets have been at their lows for about a week. However, Phoenix and Atlanta are too early to call. They may be at their lows, or there may be a further decline in listing volumes ahead.

All four markets have yet to see signs of recovery. New listings are still coming to market, and while a 50 percent drop in activity is significant, it’s not as severe as other national markets like New York City and Philadelphia.

Spotlight on Compass Markets

Compass operates in large metro areas, which have been the hardest hit. Compass’ biggest market and the nation’s worst hit market are the same -- New York City -- with a year-on-year drop in new listing volumes of over 80 percent.

Screen Shot 2020-04-25 at 7.54.11 PM.png

All of Compass’ biggest markets have been hit hard, but the good news is that they all appear to have bottomed out. It’s unlikely to get worse, and it’s possible that early recovery may have begun in Washington, D.C. and San Francisco.

Compass’ revenue is a function of the number of new listings its agents secure and then sell. Given its market concentration in some of the hardest hit national markets, it appears likely that Compass will see a disproportionately higher revenue hit than other national brokerages.

The Real Estate Market Tracker

These charts are all from a new interactive tool that I’ve launched, the Real Estate Market Tracker. Thanks to my friends at Tryolabs for help developing it, and to Redfin for access to national market data. Give it a try and let me know what you think!

U.S. Markets Suggest Checkmark-Shaped Real Estate Recovery

Past analysis has shown that the Covid-19 pandemic and associated lockdowns will cause a significant dip in real estate activity. The latest U.S market data shines a light on what the dip and recovery will look like -- a checkmark shape -- with an immediate drop, 3-4 weeks at the bottom, and a slow recovery period.

 
Screen Shot 2020-04-21 at 11.15.11 AM.png
 

Recovery in the Front Line Markets

The effects of the dip are clearest in early-hit markets like Seattle in King County. It took approximately one week to hit the bottom, with another two weeks at the bottom before a rebound began. As expected, new listings are down 50 percent for the month compared to 2019, with a slow, 20 percent recovery each week.

 
Screen Shot 2020-04-21 at 10.28.59 AM.png
 

It is a similar story in California’s East Bay market. Once shelter in place orders were issued, it took only one week to hit the bottom. The dip lasted 2-3 weeks before a rebound in activity began. Like Seattle, the recovery is slow and gradual, with new listing volumes still down 50 percent from the previous year.

 
Screen Shot 2020-04-21 at 9.21.57 AM.png
 

Dropping Activity in Secondary Markets

Markets like Austin and Portland experienced a different dip in activity. These cities were not on the “front lines” of the pandemic outbreak, and shelter in place orders followed behind the first hit metros like NYC, San Francisco, and Seattle.

Austin wasn’t hit with an extreme weekly decline of new listings, like Seattle and the Bay Area, but experienced the absence of an expected seasonal increase in activity. The result is 31 percent fewer new listings over the past four weeks compared to the same period last year. The nature of the dip is different from other markets, but the timing is similar: a week to get to the bottom, and 3-4 weeks at the bottom (so far).

 
Screen Shot 2020-04-21 at 9.02.27 AM.png
 

Activity in Portland is similar. There is a noticeable weekly decline in new listings, coupled with a lack of seasonal growth. As with the other markets, it took about a week to get to the bottom of the dip, with 3-4 weeks at the bottom. New listings over the past four weeks are down 38 percent from the same period last year.

 
Screen Shot 2020-04-21 at 9.02.03 AM.png
 

The New York City real estate market (specifically Manhattan, Queens, and Brooklyn) was especially hard hit. While the dip to the bottom occured in about a week, activity has remained bottomed-out for five weeks and counting, with no recovery in activity.

 
Screen Shot 2020-04-21 at 9.01.03 AM.png
 

A Checkmark-Shaped Recovery

The dip occurs quickly. It only takes one week, maybe two, to hit the bottom of the curve in new listing volumes. The good news is that if you’re in a market that has seen a drop in new listing volumes, the first few weeks are as bad as it should get.

The stay on the bottom of the curve isn’t long. Most markets begin to see a recovery after 3-4 weeks. The exception occurs in markets like New York City that have more restrictive shelter in place orders.

Given the staggered timing of the pandemic, some cities are ahead of others in their recovery. This gives us a glimpse of what is likely to come. Please remember: Not all markets are equal, and the severity of the drop will vary wildly between them.

 
Screen Shot 2020-04-21 at 11.15.37 AM.png
 

The recovery is not immediate; it is a slow, incremental recovery of 20-30 percent each week. It is too early to know for sure, but recovery to 2019 levels could take anywhere from 8-16 weeks. Markets in recovery mode are still down 30-50 percent from 2019 levels.

 
Screen+Shot+2020-04-21+at+10.36.31+AM.jpg
 

Rather than a V- or U-shaped recovery, the current evidence supports more of a checkmark-shape. It begins with a severe, immediate drop, lasts 3-4 weeks, and is followed by a gradual recovery.

Opendoor: Down, But Not Out

This week Opendoor announced it was laying off 35 percent of its workforce, or around 600 people. The move, designed to give Opendoor more runway, increases its chances of survival, but comes at a competitive cost -- and is far from the largest layoff the industry will see in 2020.

A Tactical Retreat is Not a Defeat

The biggest mistake anyone can make is confusing this move with the failure of the iBuyer business model. Pausing new home purchases, controlling costs, and reducing headcount are all sensible strategies in the current environment. Common advice to business leaders during uncertain situations is simple: conserve cash.

The strategies taken by iBuyers are signs of a smart business trying to survive a market downturn. Blindly pushing ahead, regardless of a rapidly changing environment, is not a smart strategy. And a tactical retreat to reassess the situation and reallocate resources is not a defeat.

The Biggest Layoffs Have Yet to Come

Massive layoffs are occurring across the real estate industry. The ones that involve full time employees generate press: Opendoor, Redfin, and Compass. But those pale in comparison to the largest “workforce reduction” that will occur in slow-motion over the next six months -- real estate agents.

Real estate agents are independent contractors that work for themselves. They don’t issue a press release when they’re out of work; they simply disappear from the workforce.

In 2019, there were about 1.3 million real estate agents in the U.S., supported by about $70 billion in commissions (that’s $54,000 per agent). If the total number of transactions in 2020 drops as expected -- perhaps up to 50 percent -- there’s $35 billion less in commissions to support those agents. During the financial crisis of 2008, the industry lost about 25 percent -- or 300,000 -- active agents.


Just because Opendoor, Redfin, and Compass are announcing layoffs is not a repudiation of their business models; it’s a reflection of their employment models. Layoffs will hit the traditional industry just as hard; it just won’t be in a press release.

Deep Pockets Win

While Opendoor claims it is well capitalized and in a healthy financial position, it’s not in a healthy enough position to completely avoid layoffs (as is the case with arch-competitor Zillow, which outlined cost-cutting measures that didn't include layoffs). 

Opendoor’s move buys it time to weather the storm, but at the expense of weakening the business. Saying goodbye to 35 percent of a well-oiled team puts it at an executional disadvantage to pre-covid Opendoor. And to Zillow.

In my Inman presentation from February 2019, I said that companies with deep pockets will win. Opendoor’s deep pockets allow it to weather the current storm and remain intact (albeit smaller). Zillow’s deeper pockets allow it to weather the storm and keep the team together, giving it a potential advantage in the coming recovery.