A Comparative Study of Real Estate Portal Revenue Growth

With the books closed on 2022, the largest real estate portals around the world have demonstrated another year in a long line of consistent revenue growth.

Why it matters: The varied revenue growth between portals highlights business model differences, market share penetration, and hints at future prospects – all while reinforcing the strong position that leading real estate portals have in their respective markets.

  • The standouts are Rightmove (U.K.), Hemnet (Sweden), and Zillow (U.S.), all for a variety of reasons.

The change in revenue between 2021 (boom market) and 2022 (contracting market) highlights differing market dynamics and varied portal business models.

  • The U.S. housing market experienced higher highs in 2021 and lower lows in 2022 compared to many international markets – leading to revenue declines in 2022.
     

  • In Sweden (Hemnet) and Australia (REA Group and Domain), the homeowner pays the portal listing fee – making it easier for portals to increase prices on a fragmented audience that transacts infrequently.


Hemnet is the clear standout in terms of revenue growth over the past four years.

  • General Atlantic, a growth equity firm, acquired a majority stake in Hemnet in 2016 – and since then the business has accelerated its growth in a remarkable way.


Dig deeper: Hemnet’s revenue growth has come from increasing its average revenue per listing, with the major driver being price increases (in addition to new premium products).

  • As the only major portal in Sweden – far above any competitors – Hemnet has incredible pricing power.


On the opposite end of the spectrum, Rightmove has the slowest growth of its peers.

  • Rightmove is the dominant portal in the U.K. and its competitive position hasn’t changed in years, but the company has a more conservative growth model and tends to “stick to its knitting” more than its peers.
     

  • It’s also reached market saturation and is only able to raise prices so much each year.


The bottom line: Real estate portals are strong businesses that typically demonstrate consistent revenue growth.

  • But across the world, not all portals are created equal: markets, business models, relative pricing power, and competitive tension all factor into growth potential.
     

  • And with an asset class as financially and as psychologically valuable as real estate, customers – real estate agents and homeowners – are willing to pay more and more each year, fueling the perpetual revenue growth machine.

The Path Forward for Zillow Home Loans


Zillow has been doubling, tripling, and quadrupling down on its mortgage business – which continues to lose money.

Why it matters: Zillow Homes Loans is a key part of the company's growth strategy, and an analysis of its current traction highlights the opportunities and challenges on a likely path forward.

Zillow’s mortgage business posted a $167 million loss in 2022, for a cumulative loss of $283 million since 2017.

  • Interestingly, while other mortgage businesses have enacted layoffs and race to cut costs, Zillow is keeping its mortgage operating expenses (OpEx) steady.
     

  • While revenue dropped in 2022, OpEx investment remained high – illustrating that Zillow is continuing to invest in mortgage without pressure to turn a profit.


To succeed, Zillow Home Loans must attach loans to the leads delivered through Zillow’s premier agent and flex programs.

  • Zillow reported that in Raleigh, one of its test markets, customer adoption of Zillow Home Loans increased from 15 to 20 percent.
     

  • This mirrors the progress of Redfin, which reported 21 percent mortgage attach in February compared to 17 percent in Q4.

Yes, but: Attaching mortgage is nothing new for traditional brokerages.

  • HomeServices of America and Prosperity Home Mortgage have achieved 25 percent attach rates at a national scale of over 45,000 funded loans annually – 10x the size of Zillow Home Loans.
     

  • Zillow and Redfin are both below the industry average, and may likely top out at 25 percent, something of a universal constant in the world of attaching mortgage.


Zillow's next act, announced in early 2022 after Zillow Offers was shuttered, included plans for significant revenue growth through mortgages (adjacent services).

  • A key component of this strategy is integrating Zillow Home Loans into Zillow Flex.


Behind the numbers: Zillow generated about 75,000 Flex transactions in 2022 – if the company scales Zillow Home Loans to 50 percent of its markets with a reasonable 25 percent attach rate, it would close around 9,300 loans and generate around $84 million in additional revenue.

  • A possible end goal could include doubling Flex transactions and launching in 80 percent of Zillow’s markets, with a stretch 30 percent attach rate – leading to 36,000 loans and $324 million in revenue.
     

  • These are large numbers with equally large assumptions; scaling a national mortgage operation is hard (and expensive and people-intensive). 


The bottom line: Zillow is experiencing some early wins in its journey to integrate Zillow Home Loans with its Flex program – but the path forward is uncertain, long, and expensive. 

  • Even after years of investment, Zillow Home Loans (and Redfin) is still playing catch up to the tried-and-true mortgage attach methods of the nation’s largest real estate brokerages.
     

  • A multitude of factors need to go right for Zillow to hit its goals: doubling its Flex program, convincing thousands of Flex agents to promote Zillow Home Loans, and standing up a national mortgage operation to handle 10x the volume. 

The Race to Cut Costs


Across the real estate industry, companies are racing to cut costs in the face of a significant market slowdown. 

Why it matters: With dropping revenues, cost control is one of the only levers in a company’s control – and is the key to a sustainable, profitable business.

  • The need to cut costs – and the depth of those cuts – are a function of a company’s overall financial health and business model efficiency.

Some companies, like eXp, have the advantage of a more efficient business model with lower operating expenses (OpEx).

  • Compared to its peers, eXp is servicing a disproportionately high number of transactions with relatively modest operating expenses.
     

  • The more traditional industry behemoths, Anywhere and Compass, have a less efficient model with a much higher cost basis (and thus need to cut faster and deeper).


Dig deeper: Another measure of business model efficiency is the amount of revenue generated per $1 spent in operating expenses.

  • Based on this metric, eXp was about three times more efficient in Q3 2022 than its publicly-listed brokerage peers (who are all in the $3–4 range).


Compass has been racing to cut its operating expenses as quickly as possible (it also recently announced a third round of layoffs).

  • Compass is driving to cut its non-GAAP operating expenses by 40 percent, or around $600 million annually.


Layoffs are the most visible way that real estate tech companies are cutting costs.

  • Since June of 2022, Compass has shed around 1,700 employees (40 percent), while Redfin has also cut deep with 2,000 fewer employees (26 percent).
     

  • Many other real estate tech companies have also enacted significant layoffs to cut costs (and in some cases, in order to survive).


What to watch: Among the big brokerages, Anywhere, Compass, and Redfin have already made significant cost reductions, while eXp and Douglas Elliman are under less pressure to cut costs.

  • Cost reductions limit a company’s ability to invest in future growth opportunities (ex: Compass has "paused all expansion into new markets” and Anywhere shut down its cash buying program).


The bottom line: The market downturn is forcing all real estate tech companies to cut their expenses in order to achieve, or maintain, profitability.

  • Unprofitable companies with high cash burn and high fixed costs have no choice but to cut, and cut deep, to survive.
     

  • While other companies operating more efficient, low-cost operating models are under less pressure to make big cuts – and may be better placed to invest in future growth.

Behind the Scenes: Writing a 361-Word Article


Last week I published 2021 Is An Outlier, Not A Benchmark, which turned out to be one of my most-read and most-shared articles of the year. Even though it was only 361-words long, it took a considerable amount of time and energy to create. I’d like to share a behind the scenes look at my writing and research process, and what it takes for me to produce a concise, high-impact analysis.

Step 1: Curiosity
All of my analysis starts with intellectual curiosity. Because I work to my own deadlines and I’m not paid to write, I have the freedom to explore. In this case, I was curious about the housing market. The key questions swirling in my head were:

  • The headlines around the number of houses sold are really negative; is it really this bad?

  • How does 2022 compare to the pre-pandemic years?

  • What else should I know about this situation?

These questions sat in the back of my mind, occasionally entering my consciousness, for months. I would pay more and more attention to the monthly reports from NAR, Redfin, and others, zeroing in on the percentage drops in volume compared to last year. This led to a thirst for more data.

Step 2: Data Collection
All of my work is evidence-based and data-driven, so I knew I needed data. In this case, the necessary data was quite straightforward: existing home sale transaction volumes. Luckily for me, the NAR tracks and reports on this, and after reaching out to them I had my hands on a significant amount of historical transaction data.

For a first, rough analysis, I threw the data into Excel and quickly plotted some charts. At first I was just looking at 2022 compared to 2021, and it was a grim visual indeed. From there I added 2019 and 2020 to build a broader picture. That’s when the first hit of adrenaline came: 2022 was performing better than 2019. I recall looking at the June numbers, and while the media headlines focused on the 15 percent decline in volumes compared to last year, I noticed that the volume in 2022 was exactly the same as 2019.


Step 3: Storytelling & Data Iteration
There was enough initial data to reveal an interesting story. Now I entered a phase of rapid iteration and exploration (more data, more visualizations, more insights). I collected ten years of historical data, back to 2012, and started plotting everything. It turns out that 2022 wasn’t a disaster after all and the monthly volumes fell within the bounds of several past years.


I also made my own estimates for the rest of the year. At the time, 2022 was running around 10 percent lower each month compared to 2019. What if volumes were down 10 percent for each remaining month? It’s rough, but it’s a start, and the result provided a relatively solid estimate on what the remainder of the year could look like.

Meanwhile, at this point I started rolling over various narratives in my head. The first was something along the lines of, “2022 isn’t as bad as it seems.” Yes, the market is slowing down compared to last year, but put within a wider historical context, the market is still active, people are still moving, and, most revealing, transaction volumes are within the bounds of historical averages.

It was around this time that I stumbled upon the answer to my question, “What else should I know about this situation?” The answer was the commission pool, and the insight produced a powerful one-two punch for the entire analysis. Not only was 2022 not as bad as the headlines suggest, but because of rising home prices, the commission pool was going to remain at near-record levels — far above the historical average.


The commission insight revealed itself thanks to my previous work. I had written about how big tech companies were coming after agent commissions in the past, so it’s a topic that occupies a permanent place in my mind. It simply appeared, like many insights do, during one of my mindless moments riding a bike, sipping coffee, driving across town, or hiking in the mountains.

For this article I also created a rough outline. My intention with an outline is to collect and order the various key insights and takeaways as I discover them.


Step 4: Data Visualizations
At this point I was committed to writing and publishing something. The bedrock of my analyses are clear, concise, and compelling charts — the creation of which is a non-trivial task!

It’s at this point I go back to my narrative; if the point is to show that 2022 isn’t so bad in the context of past years, how can I quickly demonstrate that with a clear chart? I started with a line graph showing monthly sales volumes.


The chart wasn’t compelling because the key takeaway wasn’t immediately clear. Back to the drawing board. Only after several iterations did I realize I didn’t need to show monthly volumes; annual would suffice to tell the story. Simplifying the chart helped to sharpen the narrative.


Adjusting a chart’s y-axis is a subtle way to influence how data is visualized and interpreted. It’s a mechanism that I typically steer away from (I’m generally a y-axis starts at zero purist), but in this case, I felt that adjusting the y-axis helped to tell the story in a clear and transparent way.


Step 5: Writing
Sitting down and writing a first draft may be the fastest part of my entire process. By this point, the story feels seventy-five percent clear in my mind. I start by putting all of the graphs I’ve created into one document and order them in a way that tells a clear story. Visuals first, then words.

My writing aims to weave the various data together into a clear and compelling narrative. I always start by describing the key takeaways for each graph.

For me, the most challenging part of writing is the introduction. Robert Caro, one of my favorite authors, distills down an entire book into 1–3 paragraphs before he starts writing. That’s what I endeavor to do; how can I summarize the entire analysis into one sentence? And next, why should someone care?

The writing went pretty quick for this analysis, and my subconscious chipped in with an assist. Over the weekend, the introduction simply materialized in my mind while hiking. I’m grateful for the parts of my brain that continue to tick away on something while I’m otherwise occupied.

Step 6: Editing
Just because I write something doesn’t mean it’s immediately worthy of your time. The entire piece, from data to charts to words, needs to be continually refined until it’s distilled down to its purest form. This process is agonizing and immensely enjoyable all at once, and usually lasts a few days. For this 361-word article, I read, re-read, and revised the draft at least fifty times.

Phrases like “less is more” and “quality over quantity” are often part of my everyday life. My editing goal is the same: to provide the smallest amount of information necessary to make a strong point. In this case, many extraneous sentences (and even a chart) were removed in order to provide a clear and cohesive narrative.

Every single word needs to add something to the analysis. If it doesn’t, I cut. And editing isn’t limited to words; it also includes charts. Adjusting chart titles and adding call-outs are just as important.

The following chart benefited greatly from the addition of several key percentages, explanatory text, and a visual representation of the historical average.


This chart also benefited from a pair of call-outs to reduce the mental load for the reader.


I also realized the commission pool chart would benefit from a clear visual of the additional $25 billion compared to 2019.


While editing, I send multiple draft emails to myself for the full mobile reading experience. It's important to read my drafts as my audience will, and the process helps with editing, readability, and overall flow. For this article, I sent three separate draft emails to myself.

During the editing process I occasionally nerd out a bit. I love grammar and punctuation. There’s an important difference between an en dash and a hyphen. And for this article, the Gregg Reference Manual helped me by providing guidance on how numbers should be written out in sentences. I write out “percent” instead of % on purpose. Three of my favorite books are within arms reach on my desk.


One of the final pieces of editing is getting the heading and subject line right. I don’t write headlines as clickbait — I aim for a brief, compelling summary of the content of my article. In this case, there was much agonizing over individual words: is it “2021 Is The Outlier,” or “2021 is An Outlier?” Details matter.

An important component of my editing process is time. I often do a few editing passes in a row, but then need to let it sit for a few hours while I do something else. There’s no point, at least for me, to power through the process. Once I hit a wall, I need to leave it and come back to it later, which never fails to produce a better outcome with a somewhat refreshed perspective.

Just Press Send
I could continue editing for weeks, but at some point the entire process comes to a close with diminishing returns (and my need to mentally move on to something else). I’m always thrilled to publish a new piece of work and to see the reactions. I enjoy the responses I receive from readers, oftentimes sharing their own perspectives and observations on what I’ve written about.

I enjoy writing. At times, the process can be laborious and mentally taxing, but I’m passionate about the topics I write about. My fulfillment comes from the journey, not the destination. In the end it’s the entire process — from initial curiosity to final edits — that makes me, and hopefully you, a little bit smarter.

2021 is an Outlier, Not a Benchmark


The pandemic years, especially 2021, were a strange aberration where everyone moved, house prices skyrocketed, and nearly every real estate business posted record revenues.

Why it matters: 2022 is constantly being compared to 2021, which was anything but normal, and year-over-year comparisons are painting a deeply negative picture.

Dig deeper: Assuming a fairly conservative 5.15 million existing home sales in 2022, the comparison to last year is a sobering 16 percent drop -- but 2021 is an outlier, not a benchmark.

  • Compared to the historical average of the previous eight years (2012–2019), transaction volumes in 2022 would be down only 0.9 percent.

  • By contrast, compared to the same historical average, transaction volumes were up 9 percent in 2020 and 18 percent in 2021 -- notable outliers.


Comparing 2022's monthly volumes to the historical average reveals recent volume declines that are still significant, but less extreme than a year-over-year comparison to 2021.


But in reality, 2022 has tracked favorably to the historical average and is still in somewhat "normal" territory, even considering the recent market slowdown.


The big picture: Despite dropping volumes, the commission pool -- which fuels the revenue of real estate agents, brokerages, portals, software providers, and more -- is set to be 34 percent, or $25 billion, higher than 2019.

  • This massive increase is being driven by rising home prices.

  • It would take a drop to 4 million existing home sales for the commission pool to hit what it was in 2019: $73 billion.


(These estimates assume 5.15M existing home sales at an average price of $375,000, with a commission of 5.06 percent as tracked by RealTrends. Things may change.)

The bottom line: The pandemic years of 2020 and especially 2021 were radical outliers on a number of levels, real estate being just one.

  • Issues of home affordability, dropping sales volumes, and rising interest rates are all contributing to a challenging 2022.

  • But, if we consider 2021 the outlier and not the benchmark, the market in 2022 doesn't look nearly as catastrophic as headlines suggest.

  • In fact, from a business perspective, there is significantly more money flowing through the system (from commissions) than any year other than 2021.

The Real Estate Portal + Mortgage Conundrum


The largest global real estate portals are attempting to diversify and expand their revenue streams by offering mortgage -- with mixed success.

  • Zillow, Redfin, and Australia's REA Group have all made major forays into mortgage with large acquisitions.

  • Despite being technology companies, revenue growth is closely tied to employee count, and profitability (in the U.S.) remains elusive.

Dig deeper: Redfin's mortgage revenues jumped after its recent acquisition of Bay Equity for $138 million, but the overall business remains unprofitable.


Zillow's mortgage business has been unprofitable for over five years, recently spending $1.85 for every $1 in mortgage revenue.


Australia's leading portal, REA Group, has managed to grow a profitable financial services business by acquiring two large mortgage broking businesses.

  • Financial services now accounts for six percent of REA Group's total revenue.


Behind the numbers: Mortgage growth is very much tied to people -- mortgage brokers and mortgage loan originators (MLOs).


Mortgage business growth is tightly correlated to an increase in mortgage advisors (brokers and MLOs).

  • Redfin's mortgage originations are up 10x while MLO count is up 12x after acquiring Bay Equity.

  • REA's financial services revenue is up 2.8x while its number of mortgage brokers is up 2.7x after acquiring Mortgage Choice.


Broader context: The number of MLOs is an important bellwether for the ability of other real estate tech disruptors to grow in the mortgage space.

  • Some companies have shed MLOs through recent layoffs (Reali, Tomo, Homie, Knock, and Flyhomes), while others have grown organically and through acquisition (Orchard and Homeward).

The bottom line: Billions of dollars are being invested to disrupt the mortgage process -- which is the path to profitability for many real estate tech companies.

  • Instead of leading to greater profits, mortgage has turned into a money pit for the big U.S. real estate portals.

  • And at the end of the day, the evidence is clear: it's the number of brokers and MLOs that drives meaningful business growth.

Zillow Home Loans Continues Its Unprofitable Run


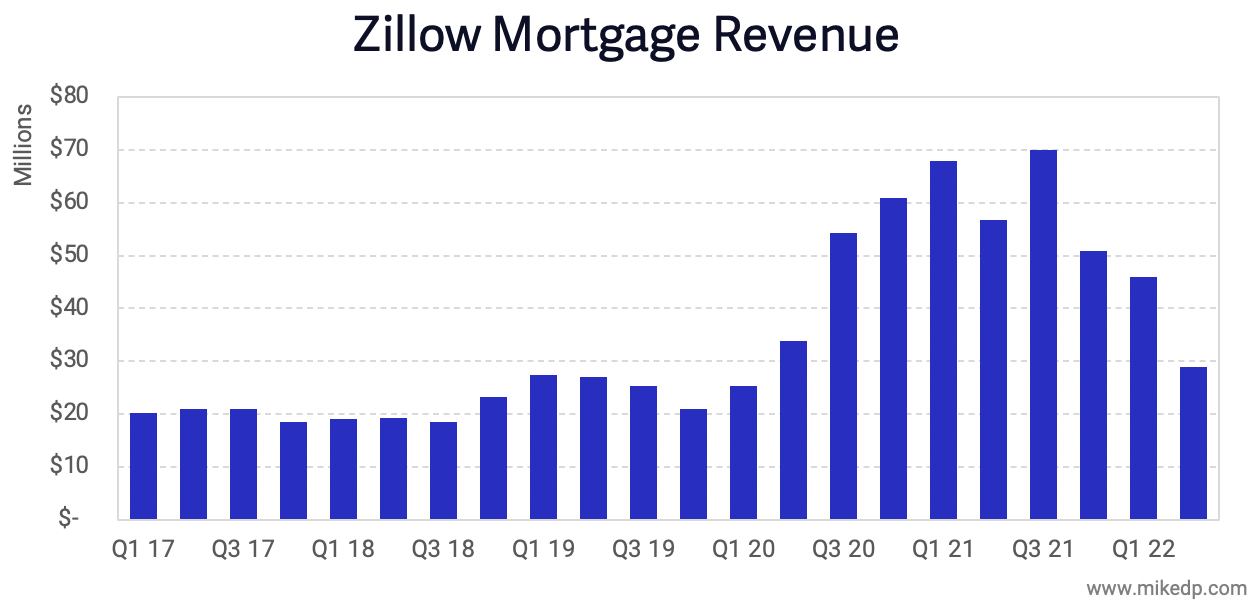
Like much of the industry, Zillow's mortgage operation, which includes Zillow Home Loans, has seen a steep decline in revenue and continues to burn cash.

Why it matters: Attaching mortgage is a key component of Zillow's "Housing Super App" and future growth strategy; the longer it falters, the less likely Zillow is to achieve its long-term aspirations.

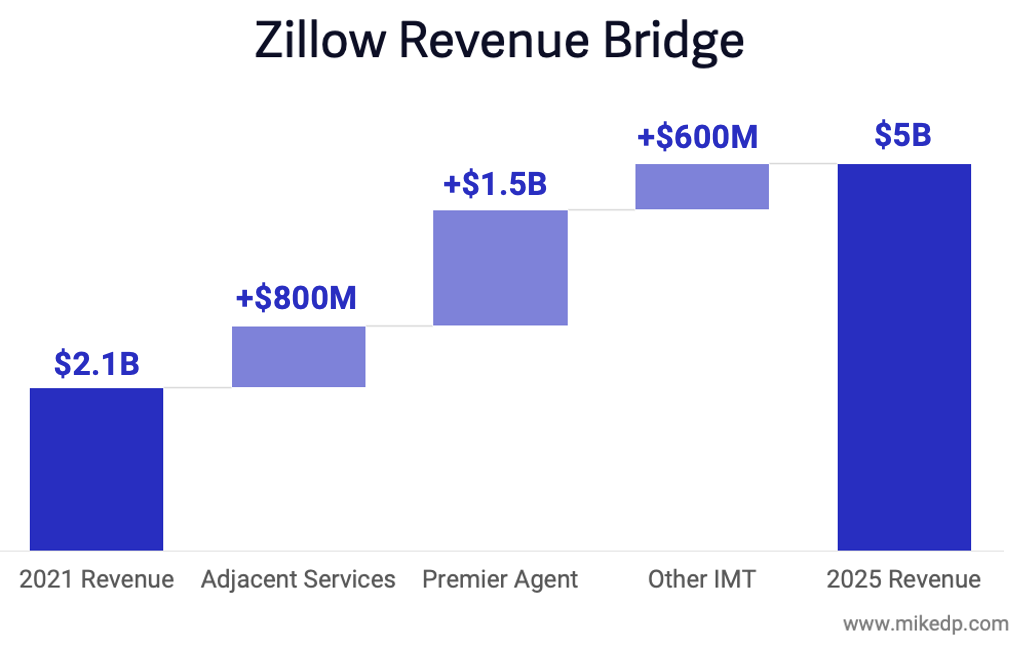
  • Zillow's 2025 goal includes an additional $800 million in revenue from adjacent services -- primarily mortgage.


Dig deeper: Zillow's mortgage segment, which includes its mortgage lead gen marketplace and in-house lender Zillow Home Loans, is consistently unprofitable.

  • In the first half of 2022, Zillow spent $1.85 for every $1 in mortgage revenue.

  • That's a $65 million loss in the first half of 2022, and a combined loss of $180 million since 2017.


Context: The entire mortgage industry is getting hammered this year, with dropping leads, loan volumes, and revenue.

The bottom line: Zillow Home Loans' path to profitability remains long, arduous, expensive, and uncertain.

The Zillow & Opendoor Partnership


Last week, former rivals Opendoor and Zillow announced a partnership to provide Opendoor's instant cash offers to Zillow's audience.

Why it matters: This is a big move for both companies. It reaffirms the continued relevancy of iBuying, gets Zillow back into the seller lead game, and gets Opendoor access to its largest customer acquisition channel yet.

But, why: It's a match made in lead gen heaven.


This partnership gives Zillow the ability to generate and monetize high-quality seller leads (consumers that are considering selling their home), something it lost when Zillow Offers was shut down last year.

  • Historically, Zillow was only able to convert 10 percent of sellers who requested an instant offer; the other 90 percent are high-quality seller leads.

  • Those leads are worth their weight in gold and can be monetized through Zillow's premier agent network (yes, I've been talking about this since 2018).

For Opendoor, this partnership represents an incredible -- and perhaps the industry's largest -- source of customer leads.

  • It extends Opendoor's ecosystem partnership strategy, which includes deals with Redfin, realtor.com, and eight of the top ten homebuilders.

  • The potential benefit to Opendoor is economic: lower customer acquisition costs, which were around $5,500 during the most recent quarter.


Perhaps most important, a Zillow Advisor will be the first point of contact for consumers requesting an instant cash offer.

  • This effectively cements Zillow's powerful position at the top of the funnel with continued, full access to the customer.

  • A Zillow Advisor will be able to discuss an instant cash offer alongside a traditional sale (seller lead), in addition to Zillow Home Loans.

Without the opportunity to upsell adjacencies, Opendoor becomes a fulfillment engine, similar to its other industry partnerships, focused on the core iBuyer transaction (buy, fix, sell).

The bottom line: This deal is both a confirmation of the relevancy of iBuying, and a continuation of that relevancy through Zillow's promotion of instant offers across its massive platform.

  • It puts Zillow back in the potentially-lucrative seller leads business, and gives Opendoor access to millions of potential customers. Win-win.


For more on iBuyers, portals, and the major shifts across the industry, check out my keynote presentation, 2022 WTF, from Inman Connect Las Vegas.

Building a Better Mousetrap: Zillow vs. Opendoor


Opendoor made over two million offers to curious homeowners in 2021, exponentially more than ever before.

Why it matters: This highlights the growing potential of Opendoor's "top of the funnel" customer appeal -- which is beginning to rival Zillow.

  • Opendoor and Zillow are both in the game of attracting consumers and converting them to monetizable customers.

Dig deeper: Of the 2.1 million offers Opendoor made in 2021, it only purchased 1.8 percent, or around 37,000, of those houses.

  • Based on the company's numbers, of those 2.1M offers, five percent, or 105k, represented unique "real sellers." Of those, 35 percent sold to Opendoor.

  • That purchase rate has decreased over time as Opendoor has ramped up the number of offers it makes while automating the offer process.


A low purchase rate does raise questions of product/market fit.

  • Based on the total offers sent out, a very small number of consumers are deciding to sell their home to Opendoor.

  • But of "serious sellers," one in three ain't bad.

Yes, but: Hundreds of thousands of consumers are actively deciding to visit Opendoor to request an offer.

  • Even if Opendoor doesn't buy the house, the company still touches a homeowner during their home buying/selling journey, creating an opportunity to cross-sell adjacent services (brokerage, mortgage, leads to agents).

  • And, as we'll see below, overall customer conversion is on par with Zillow.

Zillow's powerful top of the funnel customer acquisition tool is its web site, which generated an estimated 21M leads in 2021.

  • Of those, 1.4M were "real buyers" and 26 percent of them (360k) ended up transacting with a Zillow Premier Agent.

  • That results in an overall conversion rate of 1.7 percent, exceedingly similar to Opendoor's 1.8 percent.


Zillow's dominance at the top and bottom of the funnel is clear: 10x larger than Opendoor.

  • But surprisingly, Zillow, the decades-old industry heavyweight, is only 10x larger than Opendoor, which has made notable gains.

  • There are variations in conversion rates throughout the funnel, but overall efficacy is nearly identical.

Remember: Zillow is optimized around home buyers, while Opendoor is optimized around home sellers.

The bottom line: With similar conversion rates, neither company has built a better mousetrap, but Zillow's mousetrap is exponentially larger.

  • In terms of customer reach and the sheer quantity of leads generated, Zillow has a huge advantage.

  • But with its ongoing national expansion, heavy advertising investment, and automation of the offer process, Opendoor is making significant gains -- and the growing power of its top of the funnel customer acquisition can't be ignored.

A note on data: The last time Zillow reported the number of leads generated annually was 17M in 2016. My assumption of 21M leads in 2021 is a well-informed estimate.

Zillow Goes All In on Next Gen Lead Gen


Zillow recently announced that it was moving exclusively to its success fee Flex model in two major markets, Denver and Raleigh.

Why It Matters: Zillow Flex is "Next Gen Lead Gen," featuring a 35 percent commission share and lead qualification by Zillow employees. It's the future of real estate portal lead gen -- and gets Zillow much closer to the transaction.

  • In the past, Zillow has operated Flex alongside its traditional pay per lead model; this changes that.

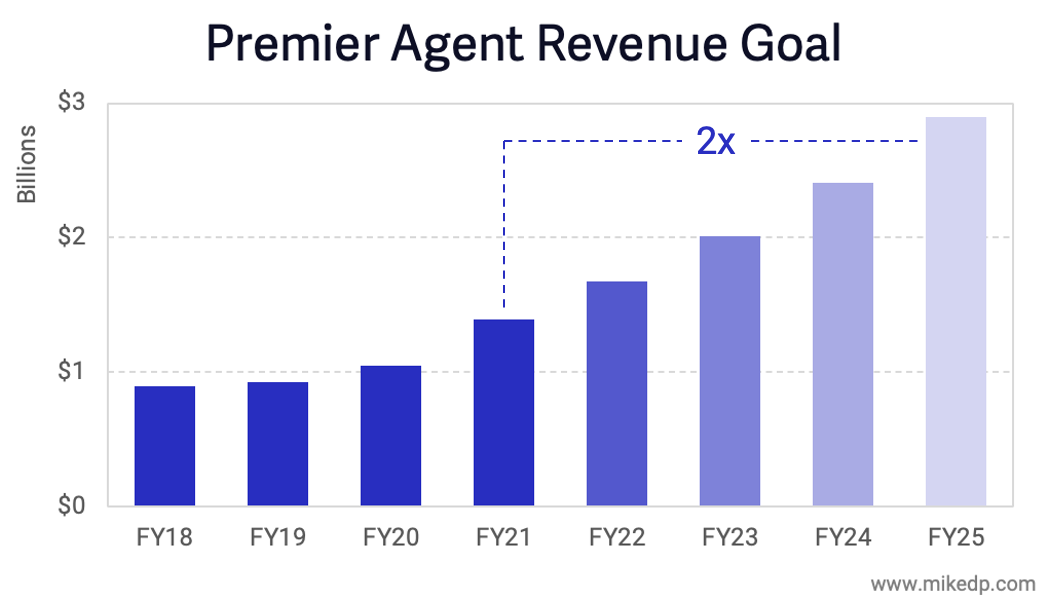
  • By going all in in two major markets, Zillow is signaling its intent to control more of the transaction in order to satisfy its goals of doubling its Premier Agent business by 2025.


Zillow's new strategy (Zillow 3.0: Back to Basics) has the company going back to its roots, doubling down on agent lead gen, and extracting more revenue from real estate commissions.


Winners and losers: Next gen lead gen works for the agent partners that decide to participate in the program; those agents and brokers receive millions of leads.

  • But those agents may become even more reliant on the portal as a critical business partner, giving the portal more market power.

  • Over the long term, agents not participating in these invite-only programs will receive fewer online leads, and may be at a significant competitive disadvantage in the race to acquire customers.

What to watch: How Zillow integrates mortgage (Zillow Home Loans) and ShowingTime into its renewed Flex program.

Next Gen Lead Gen is a major trend discussed in my Real Estate Portal Strategy Handbook. Check out a free preview of the report, or this article on the topic!

Zillow 3.0: Back to Basics


Zillow's new strategy has the company going back to its roots, doubling down on agent lead gen, and extracting more revenue from real estate commissions.

Go deeper: The biggest growth driver is Zillow's premier agent business, which it plans to double by 2025. That's an additional $1.5 billion paid by real estate agents to Zillow.

  • These are aggressive targets and a step-change from past growth rates, which reflect the audaciousness of the strategy -- and a clear signal of intent.


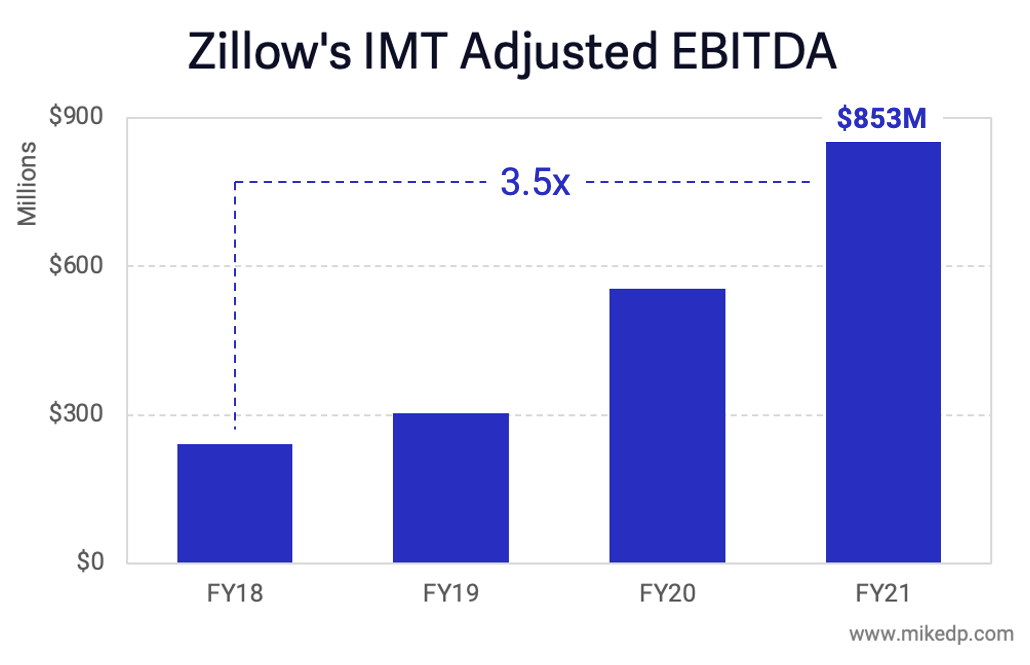
By the numbers: Zillow's core business is stronger, and more profitable, than ever, giving the company a rock-solid foundation and plenty of cash for future growth.

  • Earnings in Zillow's IMT business, which includes premier agent, more than tripled over the past three years. It's the profitable engine room of Zillow 3.0.


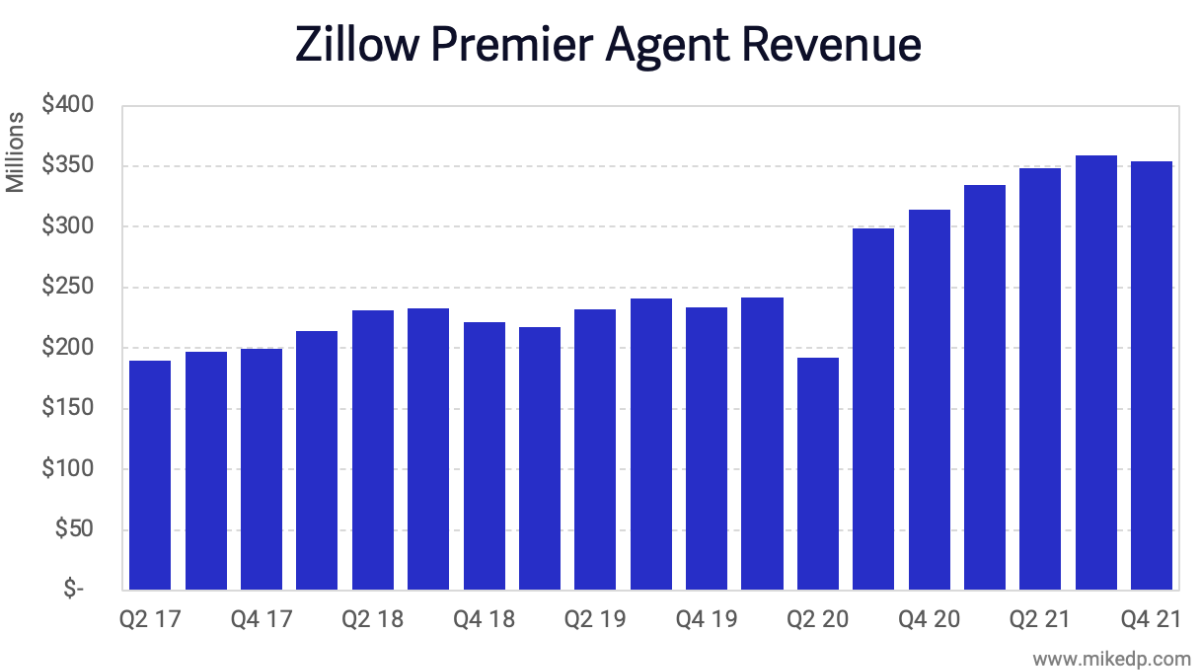
Premier Agent saw an acceleration in revenue growth driven by unprecedented demand during the pandemic.

  • But quarterly revenue growth just dropped for the first time in 18 months. The pandemic bump won't continue indefinitely.


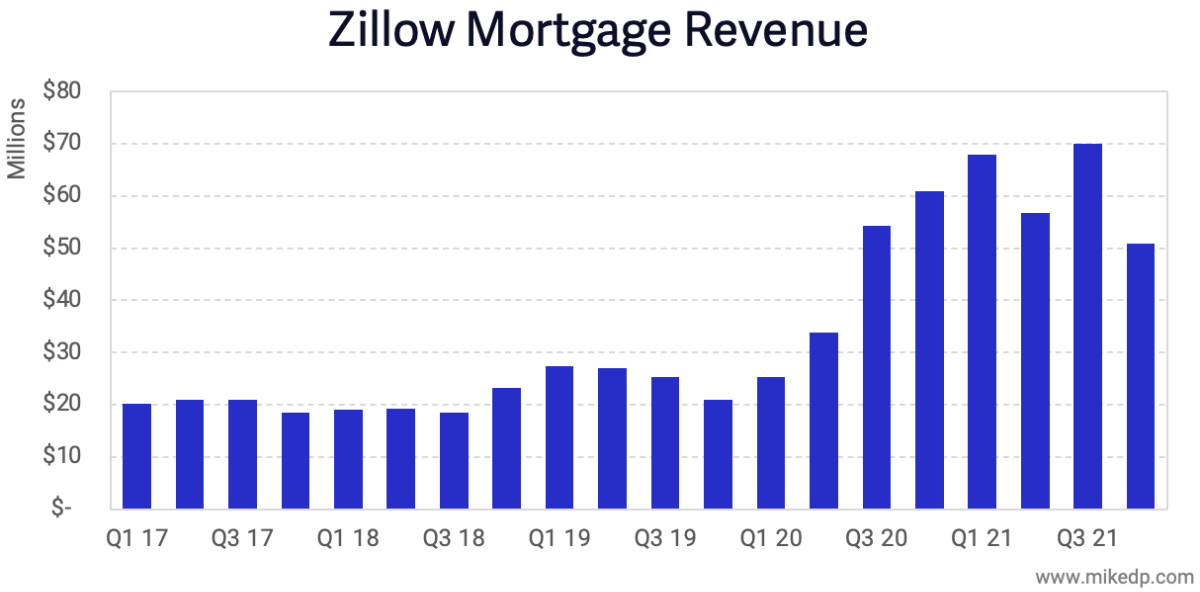
Zillow Home Loans, its mortgage play, is another key component of Zillow 3.0.

  • Like Premier Agent, revenue surged during the pandemic, but has slowed down significantly in the most recent quarter.


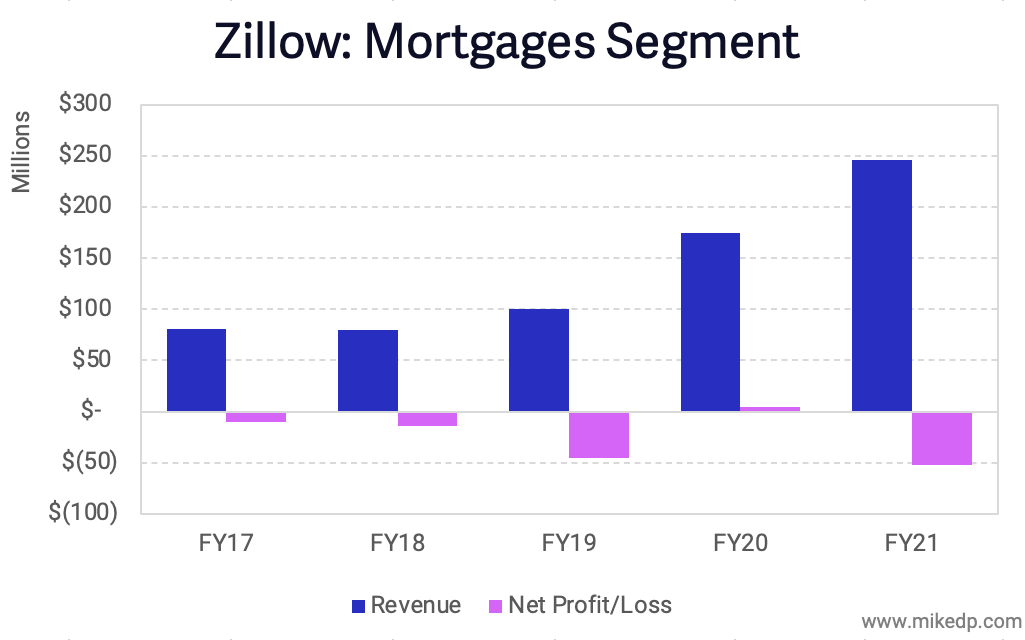
The pressing issue is that Zillow Home Loans is consistently unprofitable (net loss of $50 million in FY21).

  • Zillow is managing to lose a lot of money in a business that others can operate quite profitably.

  • The best case is that Zillow is smartly investing for the future. The worst case is that Zillow Home Loans is another Zillow Offers, beset by executional issues and overextension.


The bottom line: Zillow's 3.0 plan is centered around creating more transactions for premier agents and selling consumers adjacent services (mortgage and title).

  • Creating more transactions comes down to connecting consumers and agents in such a way that Zillow earns a commission.

  • That's a huge inflow of new business for premier agents, and it comes at the expense of non-premier agents.

Next Gen Lead Gen

Next generation lead generation is the most significant business model shift for real estate portals since their birth. It is the evolution towards delivering fully qualified leads with a commission share model, and it accounts for an increasing percentage of portal lead gen revenues -- while bringing them closer to the transaction.

An Emerging Global Trend

The evolution is occurring globally and targets both buyer and seller leads. The key themes include lead qualification and a commission share model (aka success fee).

Leading real estate portals around the world have made significant investments into next gen lead gen, including several large acquisitions.


The U.S. portals focus on monetizing buyer leads, while international portals like ImmoScout24 and MeilleursAgents focus on seller leads. The most effective way to reach prospective sellers is with property valuations: “What is my home worth?”

A key element of this model is that leads are qualified before being handed off to a partner agent. Leads are called directly by the portal, typically within minutes of submitting a form.


The second key element of next gen lead gen is the use of a commission share, or success fee, model. If a lead transacts, the agent pays a percentage of their commission back to the portal.


The commission share varies by market, but is generally around a third of an agent's commission. And this source of revenue accounts for an increasing share of portal revenue; realtor.com generates about a third of its lead gen revenue from the commission share model, as does ImmoScout24.


A Win for Consumers, Portals, and (some) Agents

Next gen lead gen lays the groundwork for a triple win: the promise of a better consumer experience, less wasted time for agents, and a more valuable product for portals.

The potential downside of next gen lead gen programs lie in their exclusive nature. It's not for everyone; agent networks consist of a small and exclusive group of the total agent pool.


Over the long term, the agents not participating in these programs will receive fewer online leads, and may be at a significant competitive disadvantage in the race to acquire customers. Next gen lead gen is revolutionizing the portal lead gen business model, but it only works for the agents that jump on board.

Next Gen Lead Gen is a major trend discussed in my Real Estate Portal Strategy Handbook.

The Real Estate Disruptors Serious About Mortgage — A 10x Story

Real estate tech disruptors are investing billions to build integrated brokerage and mortgage experiences. Some have more resources than others, but all have the same scaling bottlenecks. And in the end, the biggest disruptors -- and who is most at risk -- may come as a surprise.

The Bottlenecks to Scale

Each company employs licensed brokers -- Mortgage Loan Originators (MLOs) -- that occupy a critical position in securing or refinancing a mortgage. As with real estate, people remain a central component of the mortgage process, and no amount of technology, venture capital, or inspirational vision has yet to replace them.


MLOs are both a key component and a bottleneck for the iBuyers, Power Buyers, and others attempting to attach mortgage to their core services. The speed at which they hire MLOs, and the total number employed, is a reflection of how serious they are and their potential to grab market share.


Homeward and Knock, fresh off big funding rounds, are quickly growing. Newcomer Tomo is moving fast. Notably, the iBuyers remain relatively small. There is no outsize leader...until real estate portal Zillow is added into the mix.


Zillow has nearly 10x the MLOs of its smaller competitors, giving it significantly more scale and firepower for its integrated mortgage plans. Zillow is the top player...until pure play digital disrupter Better Mortgage is added into the mix.


Better Mortgage has raised nearly $1 billion in its quest to disrupt mortgage, and has nearly 10x the MLOs of Zillow. Significant firepower and scale, and clearly the top player...until industry behemoth Rocket Mortgage is added into the mix.


Ten MLOs to ten thousand MLOs. And: The number of MLOs roughly corresponds to closed loan volumes: $1.2 billion for Zillow, $14 billion for Better, and $65 billion for Rocket in Q1 2021.

Who's Disrupting Whom?

Both Rocket and Better recently announced they're hiring in-house real estate agents, which raises an interesting question about who's disrupting whom. Real estate tech companies are going after mortgage, but now mortgage is going after real estate.


These companies all have different approaches, but the destination is the same: an integrated real estate experience that seamlessly combines mortgage and brokerage. And the key execution trends are clear: in-house agents and MLOs, paired with deep discounts for consumers.

Perhaps the true takeaway is that those companies not included on the chart are the ones at risk. Whether it's being initiated from the real estate or mortgage side, both components are being smartly combined to provide an integrated, highly convenient consumer experience. The companies unable to provide that are the ones at risk.

Realtor.com Grows Agent Revenues Faster Than Zillow

Top U.S. portals Zillow and realtor.com recently released their latest financial results. Historically, Zillow has maintained a consistent 2.5x agent revenue lead over realtor.com. But in the last quarter that lead has slipped, as realtor.com grew its agent revenues much more than Zillow.


Since the last quarter, Zillow increased its premier agent revenues by $14 million, or 4 percent, compared to an increase in realtor.com's real estate revenues of $24 million, or 18 percent. These are each company's agent lead gen programs, and don't include adjacencies like iBuying and mortgage.


That's a big jump and an outsize increase in realtor.com's agent lead gen revenues. The growth is potentially driven by the expansion of the Opcity referral program, which now makes up 30 percent of total revenues.

Strategic Implications

The decline in Zillow's revenue lead may be the start of a trend, or it may be a temporary blip (which has been seen before). Quarterly results from the past three years show that the companies are still within the normal bounds of fluctuations.


While the revenue dominance between Zillow and realtor.com has remained relatively static, the total spend from agents has not. Combined, Zillow and realtor.com have managed to increase agent revenues 55 percent over the past two years, from $327 million to $507 million -- seemingly fueled by the hot market.


So while Zillow and realtor.com have yet to consistently outperform each other, they're still managing to extract more revenue than ever before from their best customers: real estate agents.

Compete Where You Can Win

In the fast moving world of real estate, it’s never been more important to define a crisp and effective strategy. A portion of my work consists of strategic consulting for a range of real estate tech businesses. That experience has taught me a lot, and I can sum up what I believe to be the single most important concept in strategy: Compete where you can win.

A three minute video of me talking about "Compete Where You Can Win."

Find Your Sustainable Competitive Advantage

All of my strategy work — from multi-billion dollar organizations to scrappy start-ups — starts with a somewhat cliche business school phrase: sustainable competitive advantage. This is what sets a company apart from others; the collection of unique attributes that allow an organization to outperform its competition.

In the world of real estate tech, Zillow has its massive consumer audience, Compass has its deep pockets, Keller Williams has its scale, and Realogy has its brands.

Clearly identifying a sustainable competitive advantage — a company’s strengths — is an important first step in an effective strategy. The critical second step is leveraging that competitive advantage directly against a competitor’s weakness or a market opportunity — competing where it can win.

Case Study: Compass

Perhaps the best case study is Compass. Its competitive advantage was capital ($1.5 billion in VC funding), which it used to gobble up market share.

The competitive weakness that Compass exploited was a traditional brokerage’s inability to compete on capital. Competitors couldn’t match Compass’ commission splits, signing bonuses, or marketing support. Unlike its competitors, Compass didn’t need to worry about being profitable, and the company leaned heavily into this strategy to recruit agents and grow its market share. Compass played a game that it, and it alone, could win.

Compete Where You Can Win

What truly sets yourself or your business apart from others? What can you offer that no one else can, and how can you leverage it against your competitor's weak points? It’s senseless to go up against your competitors where they are strongest (although many still try).

Anyone in real estate, from disruptor to incumbent, behemoth to startup, tech company to individual agent, can effectively compete in today's quickly changing market. It all comes down to being smart about understanding your strengths and competing where you can win.

Zillow, Power Buyers, and the Challenge of Attaching Mortgage

In 2018, Zillow set itself lofty goals when it entered the mortgage business. Three years later, Zillow's actual performance is far, far below its predictions, highlighting how difficult the mortgage space is, not just for Zillow, but for every real estate tech company targeting mortgage as a lever for growth.

Setting High Expectations

Zillow's 2018 Annual Report, released after Mr. Barton assumed the CEO role, clearly set out the company's 3–5 year goals in mortgage:

Mortgages Segment

  • Zillow Home Loans achieves a 33 percent attach rate to Zillow Offers, up from zero in 2018.

  • Zillow Home Loans originates more than 3,000 loans per month, up from nearly 4,000 MLOA loan originations in all of 2018.

The 33 percent attach rate to Zillow Offers is down from the lofty 75 percent attach rate quoted earlier by Mr. Rascoff in Zillow's 2018 second quarter earnings call:

"So for anybody who is wondering why we just bought a mortgage lender, just to hit some of those numbers again, at a mere 10,000 homes sold a month from Zillow Offers, a 75% attach rate gets to over $800 million a year of revenue opportunity for mortgage origination.”

Three years and over 10,000 homes bought and sold later, the reality is a mortgage attach rate to Zillow Offers of less than 1 percent.


(Zillow and Opendoor's attach rate is based on the markets where the service is live.)

Zillow's goal of originating 3,000 loans per month, or 36,000 in a year, remains highly aspirational. Loan originations actually took a step backwards in 2019 before rebounding in 2020 due to the pandemic and record low interest rates -- but are still less than 20 percent of Zillow's original goal.


It's worth noting that proportionally, Zillow's purchase volume (versus refinance) has steadily declined from 97 percent in 2018 to 31 percent in 2020 (and down to 10 percent in Q1 2021). The growth in Zillow Home Loans is being fueled by refi.

The Rise of Power Buyers

Ironically, Zillow is attaching more mortgages to Opendoor-owned homes than it is to Zillow-owned homes. Just let that sink in.

This bizarre fact underscores how difficult it is to attach mortgage to an iBuyer home for sale; most prospective buyers are already pre-approved. It's too late in the buyer journey to introduce and attach a new financing option.

Which is why the smart money is on companies -- I call them Power Buyers -- focused exclusively on attracting buyers earlier in the process with products like cash offer and buy before you sell. Examples include Homeward, Orchard, and Knock, and initiatives like Opendoor's Cash Offer and Zillow's video tease of it helping a Zillow Offers seller secure financing for their next purchase.

There are a multitude of companies attempting to sell mortgage and other adjacent services to their customers in an effort to increase profits. For the time being, the Power Buyers are in the lead with mortgage attach rates approaching 80%, with the iBuyers pivoting their models to catch up. Zillow's experience shows that it's a long, slow road, requiring big investment, patience, and a smart, consumer-first approach.

Zillow and realtor.com Battle for Traffic and Revenue Growth

According to the latest company results, it appears that Zillow's longstanding traffic lead over realtor.com is diminishing. In an industry where metrics like this move slowly if at all, it's fascinating. But it's also insignificant in terms of competitive advantage and revenue uplift -- and may simply be an artifact of pandemic browsing patterns -- but it does reveal a deeper truth around portal monetization.

 
image.png
 

Zillow's traffic advantage hasn't changed in years -- consistently hovering at three times the average monthly visitors compared to realtor.com. However, beginning in Q1 2020, that lead begins to erode.

 
Whatever it is, the way you tell your story online can make all the difference.
 

The timing suggests that this is likely a result of the pandemic. Perhaps Zillow has less upside, while realtor.com is benefiting from more consumers willing to visit multiple sites to see all available inventory in a high-demand, low-supply market.

A Corresponding Revenue Uplift

Across the board, the increase in portal traffic has resulted in an increase in revenues. Like Zillow, realtor.com experienced an unprecedented pandemic bump in lead gen revenues -- the first time in years.

 
image.png
 

But in this case, a rising tide lifts all boats. Both companies experienced a proportionally identical increase in lead gen revenue; Zillow's revenue lead remains unchanged at 2.5 times higher than realtor.com.

 
Whatever it is, the way you tell your story online can make all the difference.
 

The data above is an apples-to-apples comparison of each company's lead gen business: Zillow's premier agent vs. realtor.com's "real estate" revenues.

Strategic Implications


As I outlined in a recent analysis on challenger portals, there is a non-linear correlation between market share (traffic) and value (in this case, revenue). Time and again, it's "winner take most" for the #1 portal.

What I find fascinating is that despite all of the activity of the major portals, the monetization ratio has remained constant. Like the speed of light, there's an immutable law of portal monetization at play with an upper limit, unchanged despite:

  • realtor.com's $210 million acquisition of Opcity

  • A new CEO and senior management team at realtor.com

  • Zillow launching Zillow Flex and qualifying leads

And it's not just the U.S. In Australia, the top two portals have a similarly static monetization ratio despite years of intense investment and competition.

 
Whatever it is, the way you tell your story online can make all the difference.
 

At its extreme, this suggests a sort of monetization nihilism -- that nothing matters. Product improvements, senior management changes, business model shifts, global pandemics, and nine-figure acquisitions are, in the end, meaningless in terms of portals outperforming each other. There's a premium for being #1, and it just doesn't change.

What Zillow's Results Reveal About Its Momentum Towards Zillow 2.0

The coverage of Zillow's latest results is fantastically uninspiring. Lots of big numbers, devoid of context. But when the dots are connected they reveal a rich story about the business's evolution to Zillow 2.0.

Perhaps most impressively, Zillow just had its third consecutive profitable quarter! For a business that's basically operated at a net loss since inception, this is a noteworthy achievement.

 
Screen Shot 2021-05-06 at 10.03.27 AM.png
 

The move towards profitability is driven by Zillow's premier agent program -- the engine room of the company -- which is firing on all cylinders and back to impressive growth (fueled by record-breaking demand during the pandemic).


On an absolute revenue basis, Zillow's premier agent program has set a succession of all-time record quarters for the past 12 months. Zillow is generating more money from its premier agent program than ever before, which is especially noteworthy after the program ground to a halt in early 2019.

 
Screen Shot 2021-05-11 at 7.53.14 AM.png
 

Zillow's iBuyer business is back to growth mode, purchasing and selling houses at pre-pandemic levels, and still operating at a loss. But the net loss per home has dropped to its lowest level yet, a reflection of improving economics at scale.


Last week I looked at the Ecosystem Disruption in Mortgage, and how global leaders Zillow and REA Group have spent hundreds of millions of dollars expanding into mortgage through the acquisition of broker-heavy, 20 year old traditional businesses -- and not technology companies.

Zillow's mortgage business continues to grow, but it is being driven by refinancing (90%), and not new purchase (10%), business. To fully believe the one-stop-shop Zillow 2.0 narrative, new purchase volumes should grow in the future.


But while overall mortgage revenues increased, the business remains unprofitable. This is another sign that mortgage is hard, difficult to scale profitably, and tough to "reinvent" with technology. Like the Zillow Offers business, Zillow Mortgage appears to be another high revenue, low margin operation.

 
Screen Shot 2021-05-06 at 10.10.23 AM.png
 

The evidence reveals a business -- in my humble opinion -- that is still in the early innings of reinventing real estate. Zillow is clearly benefiting from the current red-hot real estate market, with its premier agent program leading the charge and funding the evolution to Zillow 2.0.

But the promise of new, adjacent services is still an aspirational goal. The various pieces are being built, but still need to be assembled in a credible way that reinvents the transaction at a meaningful scale. Momentum is on its side, and Zillow's evolution continues.