iBuyer Market Share Rockets to New High
/Before Zillow's meltdown, national iBuyer market share surged to another all-time high, blowing past all previous records by a wide margin. In Q3 2021, iBuyers accounted for 1.6 percent of all homes purchased in the U.S. That's around 28,000 homes, nearly double the 15,000 homes purchased by iBuyers in Q2.
The situation will certainly change with Zillow exiting the market and seasonality kicking in during Q4 2021. But for the time being, iBuyers have never been bigger, and Opendoor is now left as the undisputed category leader.
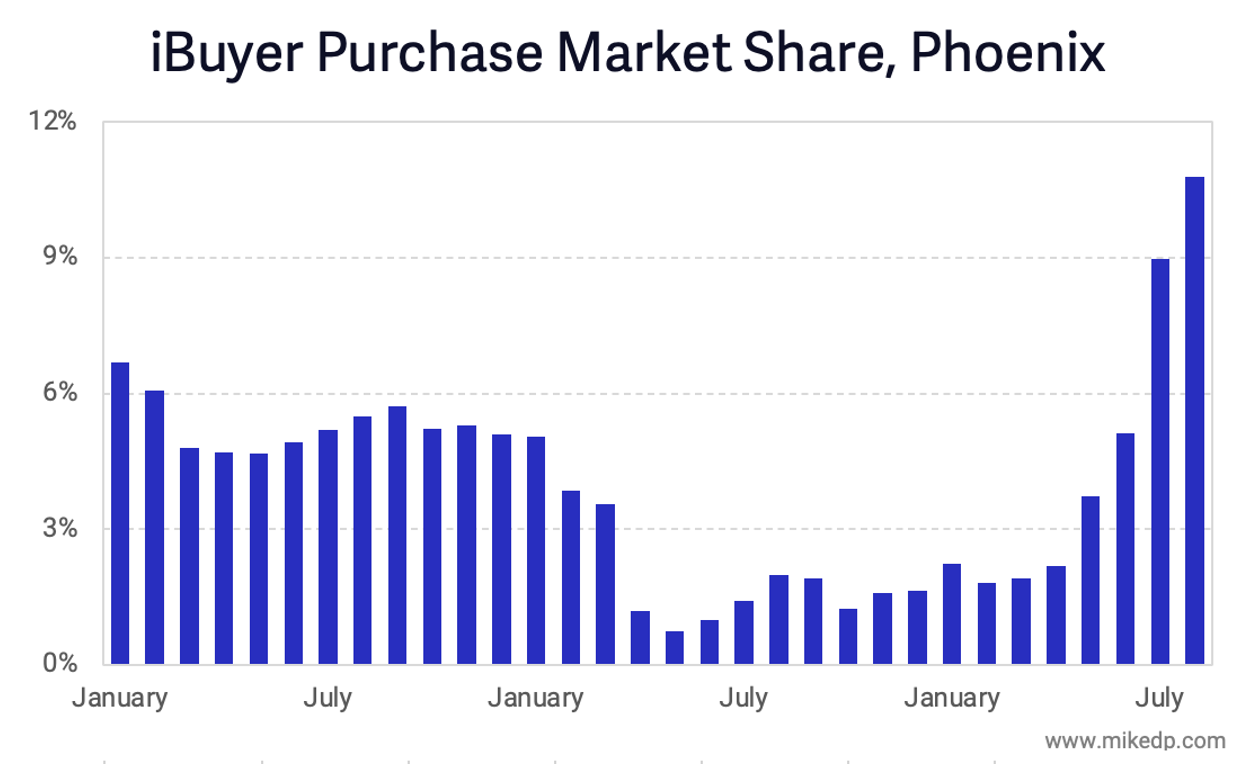
Also noteworthy: iBuyer Market share in Phoenix, the largest iBuyer market, peaked to a new high of 10.8 percent. This is the first time iBuyers have exceeded 10 percent market share in a major market -- a significant, if temporary, achievement.
Opendoor's Earnings: Painfully Normal
Both Opendoor and Zillow scaled their iBuying operations tremendously in Q3, but while Zillow's business spectacularly imploded, Opendoor demonstrated critical economies of scale. As it grows, its net loss per home is improving.
These charts show net profit/loss based on simple math: total net profit/loss for the business divided by the number of houses sold (excluding stock-based compensation expense). The result is a benchmark of business model efficiency.
While Opendoor and Offerpad improved their net profit/loss in 2021 (benefiting from record home price appreciation), Zillow's just got worse (and that's excluding the $304M inventory writedown) -- another reason Zillow Offers just wasn't working out.
As it scales, Opendoor's revenue (and gross profits) are increasing faster than fixed and variable costs. That's a positive sign, and something critically important to Opendoor's growth and profitability narrative.


