How Data Can Be Used to Mislead: Compass' Results Told Three Ways
/“In God we trust; all others bring data.” The power of data in evidence-based research is critical, but even data -- used certain ways -- can mangle the truth. As a case study of how data can be manipulated to tell different stories, I examine Compass' recent financial results three different ways.
Method 1: The Annual, Single-Company View
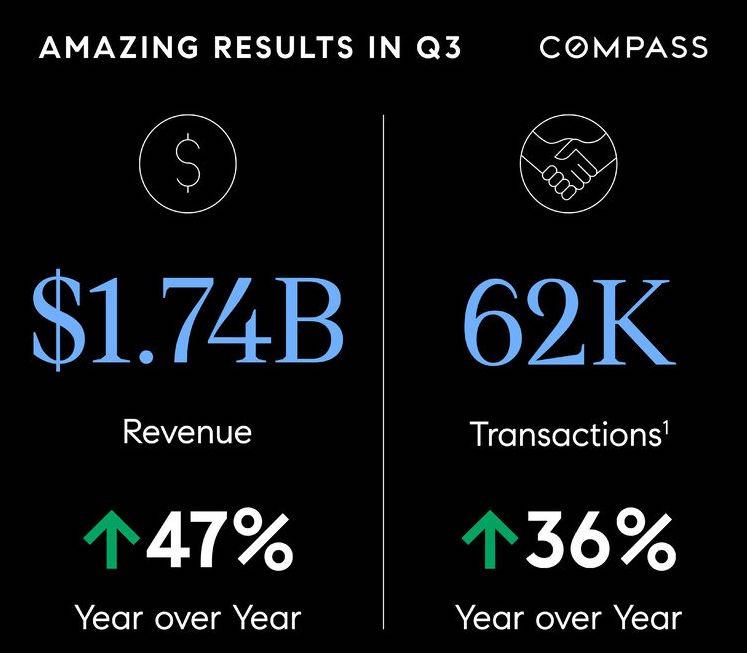
The first method, which is what Compass uses, compares key metrics to the corresponding period one year ago -- annual growth. Compared to Q3 2020 (and remember, 2020 was a pretty weird year), Compass experienced significant growth in revenue and transaction volumes -- up 47 percent and 36 percent respectively.
Compass' revenue growth was driven by more transactions, which in turn were driven by more agents (a 31 percent increase in Principle Agents). An annual comparison method accounts for seasonality in the business and is a great metric for companies in a relatively mature state, but falls short without important context.
Method 2: The Quarterly Single-Company View
An annual comparison is tricky for high-growth companies; the numbers are always huge. A granular look over time reveals deeper trends: Compared to the previous quarter, Compass' revenue actually declined, and its guidance for Q4 is a further decline.
Compass is subject to the same headwinds as any brokerage: inventory, seasonality, and agent recruitment & retention. It clearly hit a (seasonal?) peak in Q2, and now the business is slowing.
On a quarterly basis, Compass' losses are also stacking up. After approaching profitability last quarter, the company has returned to a net loss this quarter ($71 million of which is stock-based compensation expense).
A quarterly view over time introduces momentum and trends. It reveals that Compass's growth isn't steady (something that isn't clear with an annual comparison), and that the business appears to be slowing down -- with losses.
Method 3: The Quarterly & Annual Multi-Company View
This method adds additional perspective with the context of Compass' publicly-listed peers. The numbers above lack context; is Compass under- or over-performing in the market?
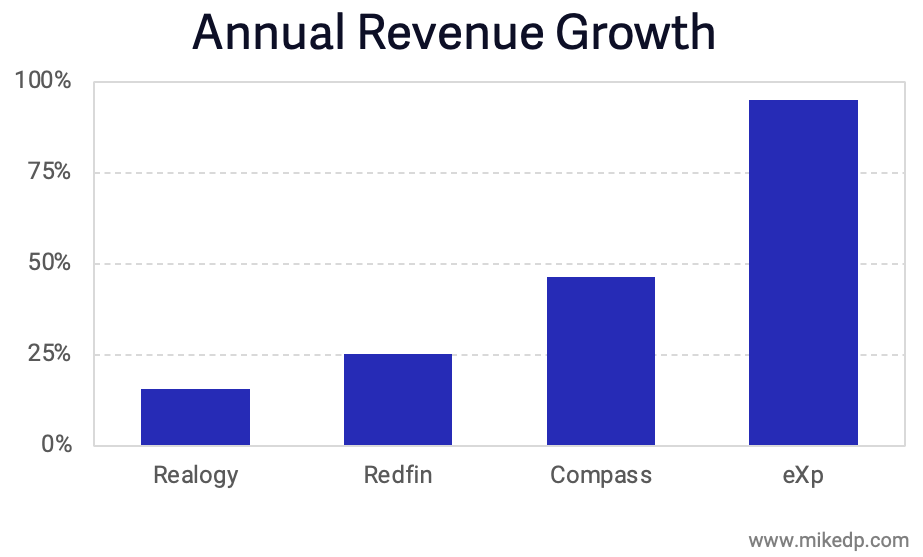
It turns out that on an annual basis, revenue is growing at all of Compass' peers. Compass' growth rate is in the middle of the pack, larger than Realogy and Redfin, but lower than eXp Realty.
On a more granular basis (comparing to the previous quarter), Compass stands out with a revenue drop larger than its peers. As we saw above, something happened in Q3, and Compass' slowdown is more pronounced than any of its peers.
Finally, it's worth noting that Compass is materially less profitable -- unprofitable, in fact -- when compared to its brokerage peers. Realogy and eXp are generating significant net profits, while Compass continues to burn cash.
A peer comparison highlights key business model differences and provides another angle on the recent business slowdown. And while Realogy may be viewed as the less exciting, slow-growth industry incumbent, it runs a sustainable, durable, and profitable business model.
Strategic Implications
There's not one, right way to tell this story. But there's always different angles to consider, and multiple data points to triangulate the truth.
Exploring the complexity of real estate through evidence, context, and storytelling is a passion of mine. It's easy to manipulate the truth, or provide various versions of it, depending on the data presented. The truth is out there -- it just takes a critical eye to find it.


